Home Win: What if Britain Solved its Housing Crisis?
SUGGESTED


Summary
- This paper is written in the style of a report from the future (the year 2035), or more precisely, from a possible future, in which Britain has successfully solved its housing crisis. Looking ‘back’, it tells the story of how this happened, and what the consequences were.
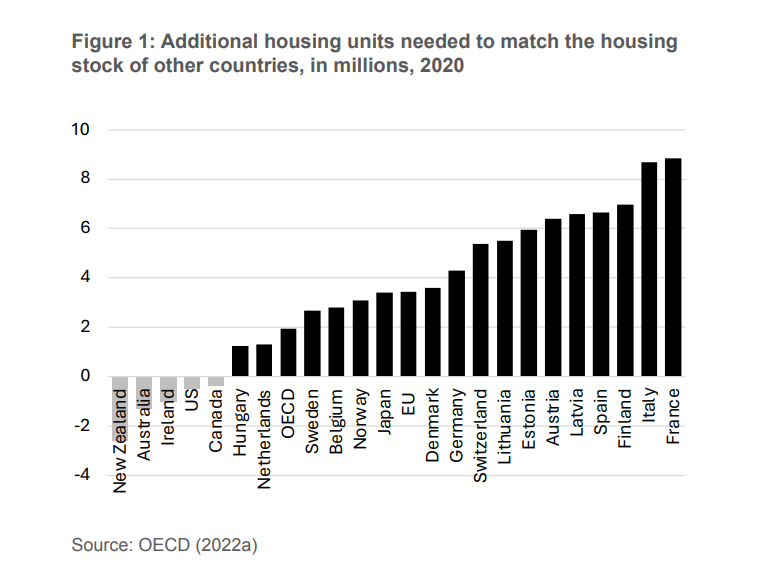
- It starts with a ‘recap’ of the ‘bad old days’ before Britain’s housing revolution (describing what is, from our perspective, the present). This is a situation of a severe housing shortage. Britain has a much lower level of housing supply than comparable countries. Catching up with the EU average in terms of the number of housing units per 100,000 inhabitants would require the construction of 3.4 million additional homes in England alone.
- Britain does not just have fewer housing units than comparable countries, but also has unusually small ones. The average British house has only two thirds of the floorspace of the average Dutch, German, Belgian or French house, and less than half of the floorspace of the average North American, Australian or New Zealand house.
- Median house prices in England stand at more than eight times the median annual full-time salary before taxes. Private sector rents in UK cities are far higher than in comparable cities elsewhere, and even though the social housing sector accounts for almost 17% of the UK housing stock (more than double the EU average and the OECD average), more than a million households are stuck on social housing waiting lists.
- Britain’s housing crisis is not just a problem for those directly affected by it; it makes the country as a whole poorer, in multiple ways. It leads to higher consumer prices across the board, it reduces labour mobility and productivity, it undermines work incentives, it comes at a high fiscal cost, and it introduces macroeconomic instability. Last but not least, it drives political polarisation, especially along generational lines.
- It has not always been this way. From the mid-19th century until the outbreak of World War II, the British housing stock used to grow by 1% to 2% per year, and housing affordability used to improve steadily. It was the adoption of a new, more restrictive planning system in 1947, and the subsequent formation of organised resistance to development (NIMBYism), which slowed down housebuilding, eventually leading to declining housing affordability.
- This paper describes how, after 2024, a future ‘YIMBY’ government decides to grasp the nettle, take on the NIMBYs, and accelerate housebuilding. It does so by, for example, selectively releasing greenbelt land around commuter stations, granting planning permission on golf courses, introducing Street Votes, building New Towns, and localising the tax system, so that communities benefit from development, and start competing for taxpayers.
- While the description of what happens afterwards is necessarily somewhat speculative (it is, after all, a hypothetical scenario), it is not plucked out of thin air. It is based on a range of empirical literature which analyses housing and planning around the world.
- On the basis of that literature, it is safe to say that this hypothetical future ‘YIMBY Britain’ would be a much richer country than the Britain we currently live in, or, for that matter, the Britain we will live in if we remain on the present policy trajectory. It will be a country with far higher housebuilding rates, lower house prices, lower rents, shorter waiting times for social housing, less poverty, less homelessness, lower consumer prices, greater labour mobility, better work incentives, lower fiscal costs, higher rates of business investment, greater macroeconomic stability, and higher productivity.
- It is also safe to say that a post-housing-crisis Britain would still be a largely ‘green and pleasant land’. Even in the South East of England (outside of London), only about 10% of the landmass is developed. Even if we had a complete housing free-for-all (which is not what this paper advocates), there is no chance whatsoever of the English countryside being ‘concreted over’.
Introduction
London-Beavertown, 2035
At first sight, Beavertown looks like many other parts of outer London. It imitates the architectural style of the 1930s, which was, of course, itself an imitation of the architectural styles of earlier periods. It has a small cluster of office buildings, two supermarkets, a pharmacy, a GP surgery, an Italian restaurant, a Chinese takeaway, a cinema, a gym, a coffee shop, a pub with a beer garden, and a brewery with a taproom. Houses here are a bit taller, more modern and more spacious than elsewhere, but, otherwise, it could be a part of almost any London suburb.
Except: if you look at a map of the area from just a few years ago, you will find no such place. Beavertown is a brand-new part of London, built on what used to be a golf course surrounded by scrubland. It has been completed at breakneck speed, and it is by no means unusual in that regard. There are hundreds of examples like it, at varying stages of completion, all over the country, especially in southern England. Beavertown is emblematic of the Great British building boom, which has seen housing construction numbers soar to levels not seen since the 1930s.
If you had emigrated from Britain in the mid-2020s and came back today, the sheer scale of new construction is probably the first change you would notice. Britain is building like mad. Even though the share of the British-born workforce employed in construction has surged to its highest level since the 1960s, the Home Office’s shortage occupation list still reads like a Yellow Pages directory of building-related trades: bricklayers, carpenters, glaziers, roofers, pipefitters, painters, decorators, tile setters, plasterers, structural engineers… Essentially, anyone who can hold a brick or a trowel will now get an automatic fast-track visa to Britain.
Of all the social and economic changes that have taken place over the past ten years or so, Britain’s building boom is turning out to be by far the most transformative one. This may seem counterintuitive at first. If you had asked people ten years ago what they thought the most exciting developments of the near future were going to be, most of them would probably have said something about artificial intelligence, self-driving cars, virtual reality and, possibly, space travel – but certainly not something as mundane as putting bricks on top of other bricks.
Yet it turned out that this boring, unglamorous, old-fashioned industry contained the solution (or at least a big part of the solution) to a lot of the country’s problems. It is a cliché to say that ‘there are no silver bullets’ in politics, but we have since learned that there very much is one, and it has been there the whole time. We just chose not to use it.
Britain’s building boom is changing the country for the better in countless ways. Most obviously, it is easing the housing affordability crisis, which is a boon for new home buyers, private renters and people on social housing waiting lists. But it also has numerous other, less obvious upsides, which benefit existing homeowners no less. It leads to falling consumer prices across the board, because it leads to a drop not just in the cost of residential housing, but also in the cost of business premises such as retail space. It is making the British labour force more mobile and productive, because it increases the payoff of moving from low-productivity to high-productivity regions. It is improving work incentives, because it means that fewer people need means-tested housing benefits, which are withdrawn as earnings rise. It leads to fiscal savings and tax cuts, because all those billions of pounds that we no longer have to spend on Housing Benefit can be passed on to taxpayers. It has made the British economy less volatile, because we no longer get these huge swings in housing wealth, and people are no longer putting all their eggs into one basket. It is easing social tensions, as the intergenerational battlelines of the last decade (i.e. ‘selfish Boomers hoarding all the housing wealth’ vs ‘entitled youngsters who can’t afford a house because they spend all their money on frivolous things’) no longer make much sense today. It is easing political polarisation as well, because it has finally reconciled a lot of Millennials (people born 1981–96) and Zoomers (people born 1997– 2012) to capitalism. We have since learned that most Millennials and Zoomers were not Marxist-Leninist revolutionaries after all: they just wanted a nice place to live, at a price they could afford.
Most political success stories are followed by a ‘…but’. This one is not. Britain’s building boom is an unambiguous success story, which has unambiguously made Britain a better place to live. If we had to qualify this statement at all, we could point out that we still have quite some way to go: Britain’s housing revolution is unfinished business. But given where we started, and where we were heading, it is an incredible achievement.
It is easy to forget now how grim things used to be before the housing revolution. A recap of the bad old days might therefore be in order.
From the mid-19th century to the outbreak of World War I, the British housing stock used to grow by between 1% and 2% per annum almost every year (Watling 2023). During World War I, housebuilding rates collapsed, but they shot up again in the interwar period, peaking at nearly 3% in the housing boom of the 1930s. This was the relative golden age of British housebuilding.
This interwar building boom was not resumed after World War II. There was still a building boom of sorts in the 1950s and 1960s, but it was no match for what had preceded it, or for what was happening elsewhere in Western Europe at the same time. After 1970, housebuilding rates dropped further, and since 1980 they had been fluctuating between just 0.5% and 1% per annum – an exceptionally low level by international standards.
As a result, the UK ended up with a lower level of housing supply than most comparable countries. Figure 1 shows how many additional homes England (UK-wide figures are not available in the same format) would have had to build in 2020 in order to match the housing stock of other countries, in population-size-adjusted terms. Matching the EU average would have required the construction of an additional 3.4 million homes; matching the housing stock of German-speaking Europe would have required the construction of closer to 5 million, and matching the housing stock of France close to 9 million homes.
Firstly, they are unadjusted for differences in dwelling size. On this measure, a country could, in theory, ‘double’ its housing stock overnight by simply splitting every housing unit into two. Indeed, for a long time, Britain used to ‘cheat’ on its housing numbers by splitting larger houses into smaller bedsits and studio flats. The result of this was that British homes were among the smallest in the developed world: they were only about two thirds the size of an average Dutch, German, Belgian or French home, and less than half the size of an average American, Canadian, Australian or New Zealand home (based on World Population Review 2024).
Secondly, Britain’s housing stock was not just too small overall, but also skewed towards the ‘wrong’ places. In a half-way functioning market, the regions with the highest house prices and rents should have seen the highest housebuilding rates. But that is not at all what we observed in the British housing market, where regional housebuilding rates were completely unresponsive to price signals (DLUHC and MHCLG 2022a).
Britain’s supply shortfall was remarkable because, in the above, we are not comparing the UK to a free housing market unencumbered by supply-side restrictions. Every jurisdiction in every country included in Figure 1 has a statutory land use planning system. Every jurisdiction in every country included in Figure 1 restricts development in some way. And even the most liberal and development-friendly jurisdictions impose at least some planning constraints that most economists who specialise in the subject would probably not consider ideal. So, when we talk about a ‘housing shortage’ in the British context, this is not in comparison to some theoretical ideal. It is in comparison to other housing markets governed by planning laws that are also flawed – just not nearly as flawed as the British one.
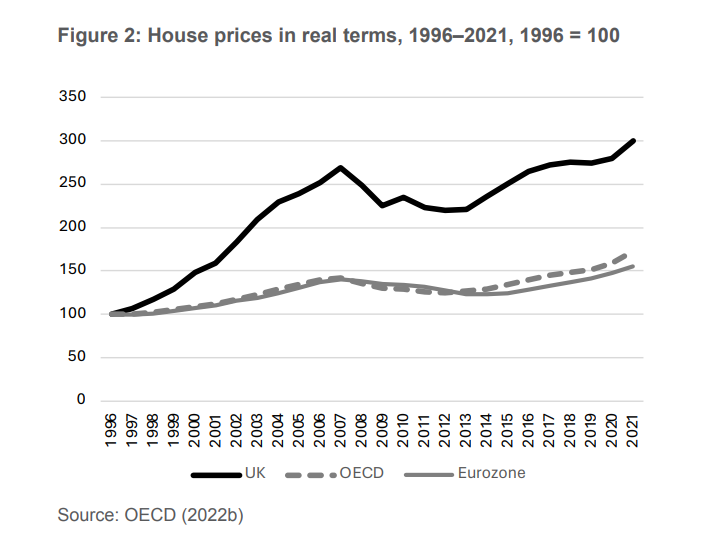
This situation led to escalating prices in large parts of the country. In the quarter-century from 1996 (when the OECD’s time series starts) to 2021, UK house prices trebled in real terms (see Figure 2). While not unique by rich-world standards (figures for Australia and New Zealand are about the same), this was nonetheless an unusually steep increase. It compares with an OECD average of 73% and a Eurozone average of 56% (OECD 2022b).
Real wages had also increased over this period, but not at anything like the same pace. We can see this in the evolution of the Housing Affordability Ratio (HAR), which is the ratio of median house prices to median gross annual earnings for those in full-time employment. Between 1997 and 2022, the HAR shot up from 3.5 to 8.3 in England, and from 3 to 6.2 in Wales (ONS 2023).
This was a historic anomaly. Lamont (2021) traced a version of the HAR1 back to 1845, and showed that for nearly 100 years, HARs had been declining almost continuously, indicating steadily improving housing affordability. In the post-war decades, that downward trend was not resumed; instead, HARs just became volatile. From the mid-1990s onwards, we see a systematic upward trend, which destroyed most of the progress on housing affordability that had been made in the meantime: it meant a return to levels last seen in the late Victorian era.
A regional breakdown of HARs shows two things. Firstly, the decline in housing affordability was a highly asymmetrical problem, which affected some regions much more than others. In 2022, the HAR was 10.1 in the East of England, 10.8 in the South East, and 12.5 in London. But, secondly, it is also true to say no region was entirely unaffected. Even in Yorkshire and the Humber, the North West of England, and Wales, which were among the least affected regions, the HAR still stood at 6.2 (ONS 2023).
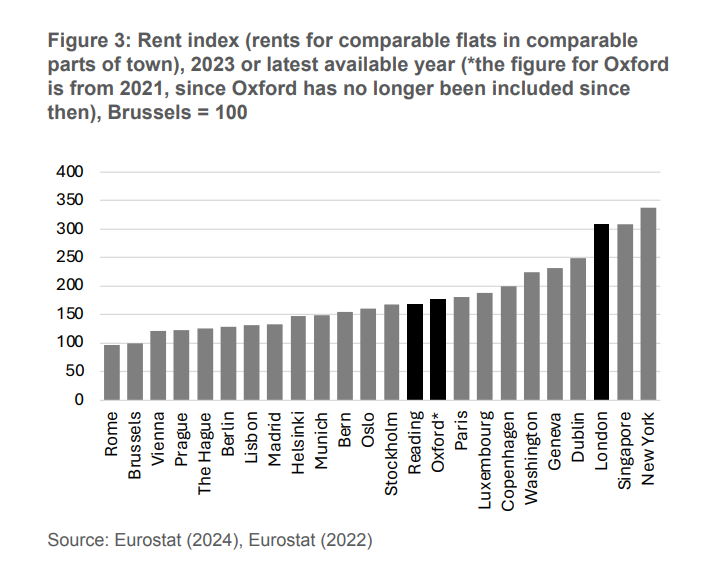
With differences in timing, rents had moved in the same direction. London, in particular, used to be one of the most expensive cities in the world and, in a European context, in a league of its own. But medium-sized cities such as Oxford or Reading were still ahead of several European capitals and economic centres in terms of rent levels (Eurostat 2022; Eurostat 2024). This can be seen in Figure 3, which shows the Eurostat rent index. It greatly understates the scale of the problem because, again, it does not adjust for differences in dwelling size. UK rental properties were not just more expensive, but were also smaller than their counterparts elsewhere (Eurostat 2022; Eurostat 2024).
In the social housing sector, rents were capped at below-market levels, but that just meant that the problem manifested itself in other ways, namely, long waiting lists, and a lack of choice and mobility. The number of households on social housing waiting lists consistently exceeded one million (DLUHC and MHCLG 2022b). Again, this understates the scale of the problem. Beyond a certain length, queues become self-limiting, as people will be discouraged from applying even if they are eligible: they simply give up trying.
This was despite the fact that social housing accounted for a large proportion of Britain’s housing stock: 16.7% of UK housing units were in the social rented sector, which is more than twice the EU average (7.5%) and the OECD average (7%) (OECD 2022c).
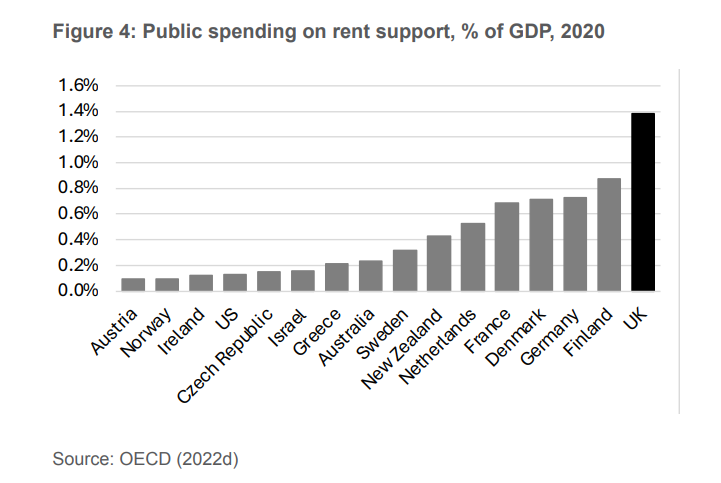
Another consequence of Britain’s housing shortage was that Britain had to spend an unusually high amount on housing cost support payments, leading to higher taxes across the board, as shown in Figure 4 (OECD 2022d).
Apart from the sheer fiscal cost, this also undermined work incentives. In the late 2010s, as many as one in five British households received Housing Benefit (and later, the housing cost component of Universal Credit). Both Housing Benefit and Universal Credit were means-tested payments, meaning that the amount a recipient was entitled to was reduced gradually as the recipient’s earnings went up. For every £100 earned above the relevant thresholds, an in-work recipient of Universal Credit would have to pay £33.25 in income tax and national insurance contributions, and they would lose £36.70 in Universal Credit, leaving them only about £30 better off. From their perspective, it was as if they paid a marginal tax rate of 70%.
The housing shortage – or more precisely, its asymmetric character – also undermined incentives for labour mobility. This is because housing costs do not vary randomly across the country. They tend to be highest in those parts of the country that are most productive and that offer the best jobs and earnings prospects.
Using figures from 2017, Figure 5 shows the Gross Value Added (GVA) per capita – a measure of productivity closely related to disposable income (ONS 2018; ONS 2021a) – of each English region as a percentage of the England-wide average. It does the same for rent levels. As we can see, the two are closely correlated, but rent levels used to vary a lot more than productivity. London was more than twice as productive as the North West, but also nearly three times as expensive, rent-wise.
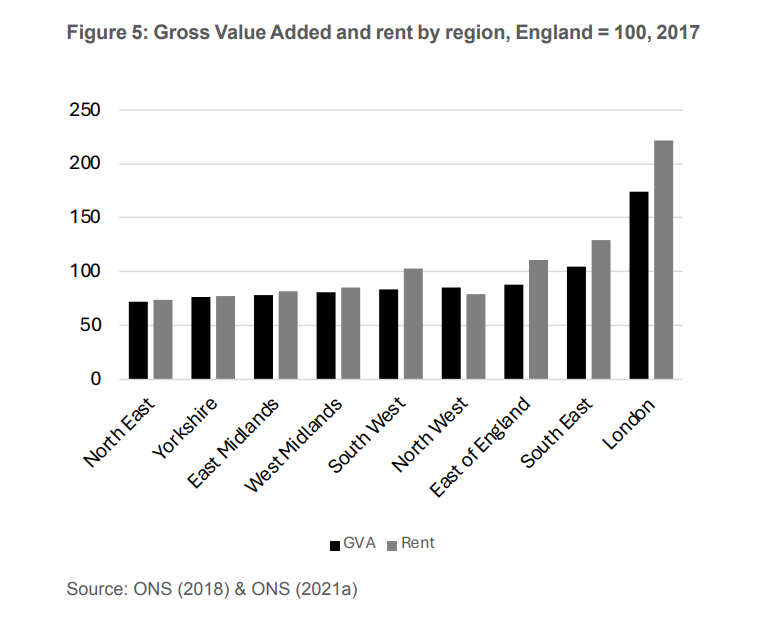
In practice, this meant that the difference in housing costs could very easily eat up most of the income gains from relocating from a low-productivity to a high-productivity area. If you moved from the North East to the South East, the additional rental cost would, on average, cancel out nearly two thirds of the additional income, and if you moved to London, it would cancel out almost all of it (based on figures from ONS 2018; ONS 2021a; and ONS 2021b).
So, it is only mildly polemical to say that, in a sense, Britain’s housing shortage replicated the feudal ‘Statute of Labourers’ from the 14th century, which restricted the geographic mobility of agricultural labourers in order to prevent them from moving in search of better wages and work conditions.
The housing shortage throttled the supply of labour in Britain’s growth areas. But it also slowed down growth in those areas in more direct ways. In this paper, we use the terms ‘housing crisis’ and ‘housing shortage’ throughout because these are generally accepted and understood terms. But they are also imprecise terms. They imply a narrow shortage of residential properties, when what Britain really had was a much broader shortage of suitable premises of most kinds: retail, offices, hospitality venues, etc.
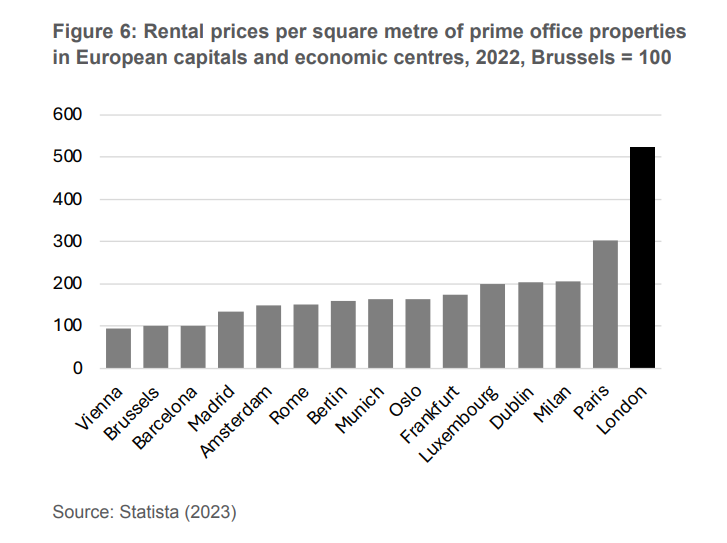
Figure 6 compares office rents per square metre in various European capitals and economic centres, relative to the Brussels level. Although not directly comparable (one is space-adjusted, the other is not), it broadly mirrors the ranking of cities by residential rents shown in Figure 3. The shortage of suitable premises raised the cost of doing business in the UK. This was, to some extent, a UK-wide problem, but, just like the shortage of residential housing, it was particularly severe in the UK’s growth centres.
This was by no means limited to offices, or to London. The Oxford-Cambridge Arc, for example, was held back by the sheer lack of lab space. As the Financial Times reported at the time:
“The science clusters of Oxford and Cambridge have almost no available laboratory spaces for rent […] [T]he crisis in lab space in the so-called ‘Oxford-Cambridge arc’ is driving companies to cities such as Boston in the US, which have millions of square feet immediately available. […] [A]vailability was close to zero in June in both [Oxford and Cambridge].”2
Even where it was not a bottleneck, the lack of business premises was still a drag on productivity. It forced countless businesses into premises that were too small, in the wrong place, and/or otherwise poorly suited for their business needs (Cheshire et al 2011).
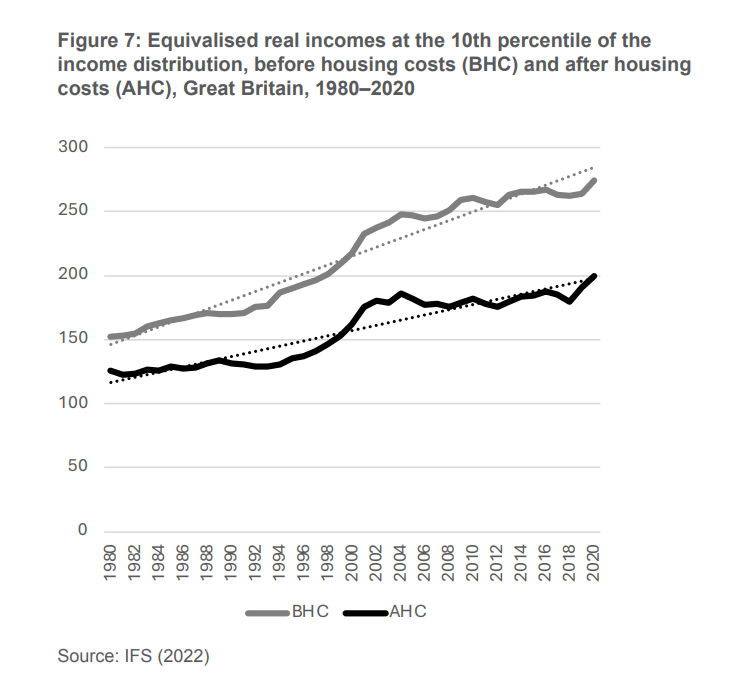
High housing costs were an issue even for a lot of well-to-do urban professionals. But they had a disproportionate impact on people at the lower end of the income distribution. We can see this by the widening gap between real incomes before and after housing costs. Figure 7 shows this for the tenth percentile of the income distribution. Between 1980 and 2020, real incomes of a low-income family increased by 80% before housing costs (BHC), but only by 58% after housing costs (AHC).
At the sharp end, the housing crisis was a major driver of poverty in the UK, contributing to food bank use and homelessness (Quigley and Raphael 2001; Barker 2003: 34).
It also made the British economy more volatile. With housing supply largely static, small changes in demand could lead to wild price swings. And since housing wealth played such a large role in people’s overall wealth, this meant that homeowners would suddenly feel a lot richer or a lot poorer, as nominal housing wealth was built up or wiped out. This unnecessarily amplified boom and bust cycles (Barker 2003: 17–18).
Last but by no means least, the housing shortage also fuelled political polarisation. In the beginning of the 2010s, the UK was not an especially politically polarised country, or at least not specifically along generational lines. Younger people tended to be more left-wing than older people, but there was nothing special about age – as opposed to social class, education level, income level, region of residence, ethnicity, gender, etc – as a dividing line (see, for example, Ipsos 20103). By the end of the decade, this had radically changed. Age had become the best predictor of political opinions (Milburn 2019).
In particular, people born after 1980 were likely to embrace anti-capitalist causes and, unlike previous generations who had gone through a youthful socialist phase, they refused to grow out of it. Right-wing commentators liked to blame ‘brainwashing’ by Marxist teachers and university lecturers, but a 2021 paper by the Institute of Economic Affairs suggested that there might be a much simpler explanation. It showed that four out of five Millennials and Zoomers blamed the housing crisis on capitalism (Niemietz 2021). For them, ‘capitalism’ did not mean their new iPhone, cheap foreign holidays, craft beer breweries, on-demand streaming or delivery services. For them, ‘capitalism’ meant forking out half of their income for a mouldy flat. So, they decided that they did not like it.
Throughout the post-war decades, home ownership rates among younger people had been rising steadily (Corlett and Odamtten 2021: 6–8). At its peak in 1990, the home ownership rate among people in their early thirties stood at a little over 60%. But from then on, it fell sharply, and by the end of the 2010s, it had fallen below 40% – about where it had been 50 years earlier. This was not driven by any detectable change in preferences in this age group (Corlett and Odamtten 2021: 16–18).
We could go on. But the point is simply that the housing crisis was not just one issue among many: it was the mother of many of Britain’s problems, and where it was not the primary cause, it was still a major amplifier. This is why Britain’s housing revolution has been such a success story on so many levels.
Britain after the housing revolution
Britain’s housing revolution took off just after the 2024 general election. Since then, growth in real wages has consistently outpaced growth in house prices and rents; indeed, in recent years, house price and rent increases have not even kept pace with inflation anymore. Thus, HARs and rent-to-income ratios are now dropping like a stone, and are expected to drop a lot further still.
This is leading to a number of transformative social and economic changes.
For a start, home ownership rates among younger people have begun to creep back up again. At long last, the Thatcherite promise of a ‘property-owning democracy’ is being extended to generations that had so far been excluded from it.
But it is in the private rental sector where we are seeing the most dramatic changes so far. The flooding of the rental market with new rental properties has put landlords under a degree of competitive pressure they could not previously have imagined. A situation in which too many tenants were chasing too few rental properties has been replaced by a situation in which too many landlords are chasing too few tenants.
As a result of this, tenants have become a lot pickier and choosier. Attitudes among tenants have changed from ‘Beggars can’t be choosers’ to ‘Choosers won’t be beggars’.
The impact on the social housing sector has been no less transformative. The improved affordability of market housing has led to a sharp reduction in demand for social housing, and thus a steep drop in waiting times.
Social housing used to be tightly rationed via a highly complex and bureaucratic administrative process, which offered (prospective) tenants very little choice or flexibility. It had to be: when over a million households are waiting, you cannot be too picky – you have to be grateful for what you are given.
For the first time in ages, we now have a situation where, in most parts of the country, the supply of social housing broadly matches the demand for it. This new situation is now making it possible to relax the allocation rules. The new system, which is currently being rolled out, will give much greater weight to applicants’ preferences. For existing residents, it will also become easier to swap one social housing flat for another.
As mentioned, in the early 2020s, Britain had to spend 1.4% of GDP on financial support with rents. Since the start of the housing revolution, that share has been falling every year, when under the old trajectory, it was set to increase. Governments have been able to pass on those fiscal savings to taxpayers in the form of modest but broad-based tax cuts. This is one of the ways in which existing homeowners – not just renters and new homeowners – have benefited from the new situation as well.
The housing revolution has not simply meant an across-the-board increase in construction activity, but also a fundamental rebalancing of where that construction takes place. As mentioned, until the mid-2020s, regional housebuilding rates bore almost no relation to regional price signals. Since then, they have been tracking them much more closely. The drop in HARs and rent-to-income ratios has therefore been most pronounced where they are highest, leading to a narrowing of the spread between the country’s most and least unaffordable regions. If you live in the North East or in Yorkshire and the Humber, you may have noticed some improvements in housing affordability, but it will not feel like a revolution. If you live in London or the South East, it very much does.
Housing costs still vary considerably across the country, but we are now moving towards a situation where regional variation in housing costs mostly reflects – and is not much greater than – regional variation in incomes. This is making it a lot more lucrative to move from low-productivity to high-productivity regions. The recent surge in labour mobility is a consequence of that.
The boom in residential construction has been accompanied by a boom in commercial construction: the creation of new office space, new retail space, new lab space, and so on. The result of this has not been ‘more of the same, just bigger’. Rather, the result has been a wave of productivity improvements, with businesses relocating to more suitable premises where they can be more productive (as predicted long ago by Cheshire et al 2011). Most of these changes happened behind the scenes, invisible to most of us. But what we have certainly noticed is how consumer prices have fallen in real terms across a range of sectors, especially retail, catering and hospitality.
The housing revolution has not just made the British economy more prosperous, but also less volatile. For the reasons already explained, the British economy used to be unusually dependent on house prices (Barker 2003: 17–18). But house prices are no longer subject to the same wild, unexpected swings, and housing wealth no longer plays the same role in people’s personal finances, as Britain is no longer the all-eggs-in-one-basket economy it once was. Houses are no longer seen as an investment. They are seen as a place to live.
There has also been a marked drop in poverty, starting at the sharp end of it: homelessness. Homelessness has always had a variety of causes, and some homelessness would still exist even if housing were offered for free. Nonetheless, we have long known that, up to a point, improving housing affordability decreases homelessness (Quigley and Raphael 2001; Barker 2003: 34), and the recent British experience bears this out. A similar logic applies to the use of food banks.
Although this was not initially the motivation, there have been environmental benefits as well. For a long time, Britain used to have poorer energy efficiency standards than most neighbouring countries. It is not that all British homes were energy inefficient. It is just that Britain used to have the oldest housing stock in Europe (European Commission n.d.), and the energy efficiency standard of a dwelling is strongly correlated with its age (ONS 2022). Rejuvenating the housing stock has therefore accidentally driven up its average energy performance.
There have also been plenty of less tangible benefits. For years, urban planning nerds used to throw buzz phrases such as ‘walkable neighbourhoods’, ‘gentle density’ and ‘mixed-use development’ around. The idea was to create neighbourhoods where one can engage in most everyday activities without having to travel very far, thus reducing commuting times and reliance on cars.
Britain’s housing revolution, whether by accident or by design, has moved parts of the country a lot closer to that vision. New neighbourhoods such as Beavertown, as well as urban extensions and New Towns, have generally been built at medium densities, and a number of suburbs have been densified to similar levels. They have become minor employment, commercial and leisure centres in their own right, rather than just dormitory towns or suburbs for people who spend most of their lives elsewhere.
Last but by no means least, the Britain of the 2030s is also a less politically polarised country than the Britain of the 2010s and 2020s. Easing the housing crisis seems to have had the remarkable side-effect of reconciling the Millennial generation and Generation Z with the market economy. It is true that Millennials and Zoomers remain overwhelmingly left-leaning generations, even as the oldest Millennials have entered their fifties. But there is left-wing, and there is left-wing: there is ‘Smash capitalism! ¡Viva la revolución!’, and there is ‘Let’s be more like Sweden.’ Most Millennials have not crossed over to the other side of the political spectrum, but plenty have moved from the former brand of leftism to the latter.
These are just some of the benefits of Britain’s housing revolution. But what about the downsides? Surely, there must be a catch somewhere? If the consequences of a housebuilding boom are all so obviously beneficial, why did we have to wait until 2024 to make it happen? Could this not already have happened 10, 20, 30 or even 40 years earlier?
The answer is: it could have, and it should have. The downsides, such as they are, have been quite negligible. Yes, some green spaces have been lost. But there has never been any truth in the idea of Britain as an ‘overdeveloped’ island, and there is still no truth in it now. Before the housing revolution, less than 10% of England (never mind the less densely populated regions of the UK) was developed (see Table 1). Even in the most densely populated English region, the South East, this was not hugely different. The only genuine outlier here was (for obvious reasons) London.

So, while the overall amount of undeveloped land has decreased a bit, it has decreased from a very high level. But, perhaps more importantly, this decrease has not made England less of a ‘green and pleasant land’. We have lost some muddy fields, but the impact on meadows, forests, nature reserves, heathland, moorland, hills, lakes and coastal areas has been minimal. ‘The countryside’ in this latter, more meaningful sense has not been diminished.
There has long been a slow but steady downward trend in agricultural land use (Our World in Data 2022a), and towards rewilding and reforestation (Our World in Data 2022b). Such trends have accelerated since the housing revolution, partly as a result of a deliberate policy drive (because politicians wanted to guard themselves against accusations of being ‘anti-countryside’).
Of course, anti-housing protesters care about a specific plot of land near them, not about national aggregates or percentages of the English land mass. Some people clearly have seen changes in their local area that they did not like.
Still, the claim that the English countryside is disappearing under a carpet of concrete has always been wrong, and it remains wrong today.
If we had to find a fly in the ointment, we could point out that Britain is still far from being the best in class. No foreign visitor would marvel at our cheap rents or property prices, or be attracted to move here specifically for this reason. London remains an expensive city, even if it is no longer out of line with other European capitals, and housing affordability remains a concern for many voters. It is not that the problem has been ‘solved’. It is just that housing is now one issue among many, rather than the mother of all problems.
All in all, then, Britain’s housing revolution has been a transformational success story. So how did this happen? How did Britain manage to turn itself around so impressively?
Before we can address that question, we first need to describe how Britain got into this mess in the first place.
The causes of Britain’s housing crisis
As mentioned, for at least a hundred years, Britain experienced steadily improving housing affordability, as income growth consistently outpaced house price growth. In the mid-19th century, the average house price stood at about twelve times average earnings. On the eve of World War II, that ratio had dropped to around four.
The Town and Country Planning Act of 1947 was a watershed moment. Its main effect was to reverse the default option for the permission to build. It replaced a permissive system, in which development is generally allowed unless specifically prohibited, with a restrictive one, in which development is generally banned unless specifically allowed.
Then in the mid-1950s, the government began to introduce greenbelts around major cities. Greenbelts are urban growth boundaries (indeed, that is what they are called in other English-speaking countries), that is, buffer zones around urban areas where virtually all development is banned.
The impact of these policy changes was not immediately visible: some even see the post-war decades as a ‘golden age’ of council housebuilding. But this impression is misleading. While the housebuilding rates of the 1950s and 1960s may seem impressive when compared to later decades, they already represented a decline compared with the housebuilding rates of the interwar period, the Edwardian and the late Victorian period. They were also among the lowest in Western Europe (see Watling and Breach 2023: 10–18).
The post-war decades were therefore a period of relative decline for British housing. In the mid-1950s, Britain still had a larger housing stock relative to population size, than, for example, Switzerland, West Germany and Finland (Watling and Breach 2023: 19–21). But Switzerland and West Germany overtook Britain around 1970, and Finland did so around 1980. Denmark started in roughly the same place as Britain, but pulled ahead, and Sweden, which already enjoyed a lead over Britain in the 1950s, increased that lead further.
Britain did not just build fewer new homes, but smaller ones as well. By the early 1990s, Britain had fallen far behind the rest of Western Europe in terms of floorspace per dwelling (Watling and Breach 2023: 22–23).
In short, the post-war planning system was considerably less development-friendly than the system it replaced. To make matters worse – it grew even less development-friendly over time. According to a conservative estimate published in The Economic Journal, in 2008 35% of the average house price in England could be directly attributed to incremental planning constraints brought in after 1974 (Hilber and Vermeulen 2014).
Greenbelts also expanded in size. In 1979 about 5.5% of the land of England was designated greenbelt. In 2022 that figure stood at 12.6% (Rankl and Barton 2022: 15–16), most of it prime real estate in areas of high housing demand. At that stage, they were no longer really ‘belts’, because a belt is not usually wider than the person or object it surrounds. Britain, however, had more greenbelt land than developed land.
It is important to note, though, that when the post-1947 planning system is described as ‘too restrictive’ or ‘anti-development’, this does not just refer to formal rules and regulations. Rather, it refers to the way the system got captured by vested anti-development interests.
Like many other economic activities, housebuilding creates winners and losers. It benefits, most obviously, the residents of those new houses. However, for existing homeowners it can mean a decrease in their property value, a loss of open spaces, crowding, nuisance, and additional demands on local infrastructure and public services. This was a highly asymmetric political conflict, because it was much easier to identify and mobilise the opponents of housing development than the beneficiaries. Most of the beneficiaries can only be identified retroactively, namely, once the new houses have been built, and somebody has moved into them. Before then, nobody knows who these people are going to be, and the only beneficiary who can be identified ex ante is the landowner. The opponents, on the other hand, will readily come forward and identify themselves. Therefore, those who participated in local planning consultations were a heavily self-selected group, consisting predominantly of opponents.
These problems have been well known and well understood for quite some time. Already in 1988, long before housing became a high-profile issue, the Institute of Economic Affairs published the book No Room! No Room! The Costs of the British Town and Country Planning System by Prof Alan Evans, who argued:
“[T]here are […] significant economic costs associated with the planning system. It has significantly increased land and housing prices […] and distorted the economic structure, all of which have led to the British standard of living being lower than it otherwise would be. […]
“The aggregate reduction is […] probably of the order of 10 per cent or more of national income.” (Evans 1988: 50)
At the time, there was not a lot of empirical research that focused specifically on the British housing market. But there was already an extensive international body of research, biased towards US housing markets but with some generalisable findings.
In 1990 a literature review in the journal Land Economics summarised the state of that research in the following terms:
“There is now a large empirical literature documenting the effects of growth controls on housing and land markets. The evidence to date conclusively establishes that growth controls raise housing prices in communities where they are imposed.” (Brueckner 1990: 327)
Twelve years later, another literature review, published in the journal Land Use Policy, found:
“The most important policy implication to be gleaned from this review is that local planners play a significant role in determining the severity of housing price inflation attributable to urban containment policies.” (Dawkins and Nelson 2002: 11)
In the same year, the IEA published another book on the subject, Liberating the Land by Prof Mark Pennington, who argued:
“[T]he local amenity lobby […] are keen to prevent any development from taking place ‘in their backyard’ and have been particularly successful in stopping new housing developments in high demand areas such as South-East England. Evidence from the local planning process suggests that over 60 per cent of the changes brought about by the process of public participation result in a reduction in the amount of development proposed […]
“The principal effect of such restrictions has been the inexorable rise in the price of housing land and hence house prices brought about by the increased scarcity of supply. While there is continuing academic debate as to the precise magnitude of the price rises that may be attributed to such nimbyist action, that prices have risen as a consequence is in little doubt.” (Pennington 2002: 62–3)
These were think-tank and academic publications, which were not necessarily known to policymakers. However, in 2003 the Blair government commissioned a study by Bank of England economist Kate Barker, who summarised her findings in an Interim Report (Barker 2003) and a Final Report (Barker 2004). Taken together, these reports became known as the Barker Review, and it aged remarkably well.
Barker began with the following observation:
“The UK housing market is unusual, in that over the past 30 years there has been a long-term upward trend in real house prices of around 2½ per cent per annum […] By contrast, […] the increases in many other European countries, such as France and Germany, have been much lower.” (Barker 2003: 16)
She pointed out that housing supply in the UK had become completely unresponsive to price signals, and that this had led not only to escalating housing costs, but also to all kinds of economic problems. She presented estimates for an ‘alternative Britain’, which was identical to the actual Britain up until 1994, but which then deviated from it in one respect: it increased the price elasticity of housing supply to 2.0. (This means that every 1% increase in house prices translates into a 2% increase in the housing stock.) After just eight years – that is, in 2002 – that alternative Britain’s GDP was almost a percentage point higher than that of the actual Britain. It also created over 350,000 additional jobs that the actual Britain did not create (Barker 2003: 24–6). An elasticity of 2.0 would have been relatively high, but not at all unachievable: it would have meant matching the performance of the German housing market (Barker 2003: 43–4).
Barker also presented estimates which suggest that if the UK wanted to limit future house price growth to the European average, annual housebuilding numbers would have to almost double (Barker 2003: 58–60).
Barker warned that ‘in the absence of structural changes […], national home ownership rates will reach only 71.7% by 2016. Unless there is a structural change in supply, most higher demand will be squeezed out by higher house prices’ (Barker 2003: 23–4).
The actual home ownership rate in 2016 was 62.3% (DLUHC & ONS 2021), so, if anything, we can criticise the Barker Review for underestimating the true scale of the problem, for being too timid.
On the causes of the housing shortage, Barker said:
“The relationship between supply and affordability is not always recognised in debate: the lack of market affordable housing is bemoaned, while, at the same time, new housing developments are fiercely opposed. […] [T]his issue has the characteristics of an insider-outsider problem, where those inside the housing market have more power over any decisions than those outside and their decisions naturally reflect their own interests rather than those of the wider community.” (Barker 2004: 14–15)
And elsewhere:
“The conclusion of the Interim Report was that land supply is the key constraint to increasing housing supply […]
“In some areas not enough land is allocated for development and/or the rate of land release is not responsive to market conditions and rising house prices. Housebuilding is often politically contentious and […] the incentives facing decision makers do not reflect those costs and benefits. Local costs of development can be high and those already housed have a much stronger voice than those in need of housing.” (Barker 2004: 25)
And finally:
“The analysis presented in the Interim Report identified a number of factors contributing to constraints on land supply. These include […] weak local incentives to develop land, and planning through its influence on the amount of land permissioned for development and made viable through supporting infrastructure. […]
“The approach to setting housing numbers […] is frequently determined by political decisions, often reflecting negative local attitudes to development.” (Barker 2004: 31–3)
The political reception of the Barker Review set an unfortunate precedent, in that it was widely praised, but then nothing happened.
This would happen again and again in the subsequent 20 years, under Labour governments, Tory governments and coalition governments alike. Nick Boles, who was Minister for Housing and Planning from 2012 to 2014, started with the correct diagnosis and the right ambitions:
“[I]n Germany real house prices have remained constant since 2000. And in the Netherlands, […] real house prices rose by a little bit more than a fifth in the same decade.
“So why did they nearly double in the UK? The answer is simple. We’ve built too few houses […]
“We have to accept that we are going to have to build on previously undeveloped land. […]
“[S]ome [councils] are dragging their feet. […]
“[T]hat is not acceptable. […] [T]he government will not support those local councils who abdicate their responsibility to meet their fair share of our common housing needs.” (Boles 2013)
But then nothing happened.
Similarly, Sajid Javid, Housing Secretary 2016–2018, also started with the correct diagnosis and the right intentions:
“The housing market in this country is broken, and the cause is very simple: for too long, we haven’t built enough homes. […] This isn’t because there’s no space, or because the country is ‘full’. Only around 11 per cent of land in England has been built on. The problem is […] not enough local authorities planning for the homes they need; house building that is simply too slow; and a construction industry that is too reliant on a small number of big players.” (DCLG 2017: 9)
But then nothing happened.
Robert Jenrick, Housing Secretary from 2019 to 2021, was another reformer who started with the right diagnosis and the right intentions:
“[The planning system] simply does not lead to enough homes being built, especially in those places where the need for new homes is the highest. […] The result of long-term and persisting undersupply is that housing is becoming increasingly expensive […]
“In Italy, Germany and the Netherlands, you can get twice as much housing space for your money compared to the UK.” (MHCLG 2020: 14)
But then nothing happened.
What explains this curious recurring pattern of policymakers diagnosing the problem correctly, and then not doing anything about it?
At one level, the answer is trivially simple: because every time a government tried to, they ran up against fierce resistance from anti-housing campaigners. But that cannot be the whole story. Governments often do things that are extremely unpopular with a section of the electorate, and that provoke a fierce backlash. UK governments have repeatedly pushed things through in the face of sustained mass protests. For better or worse, neither the anti-Iraq War protests nor the anti-austerity protests nor the anti-Brexit protests changed government policy. So why did the opponents of housebuilding have that power when much more militant and visible protest movements did not?
Essentially, the answer is that governments will be prepared to ignore protests if they are confident (rightly or wrongly) that a silent majority is on their side, and, crucially, that this silent majority will act accordingly.
The first of these conditions was probably met: there probably was a silent pro-housing majority in the early 2020s.
Since 2019, YouGov had been running an opinion tracker on two housing-related questions, which they asked every month:
‘In principle, would you support or oppose a large increase in the amount of new housing built in Britain?’4
‘And would you support or oppose a large increase in the amount of new housing built IN YOUR OWN LOCAL AREA?’5 [Capitalisation in the original]
We could describe the opponents of housebuilding as NIMBYs (Not In My Back Yard), and its supporters as YIMBYs (Yes In My Back Yard). Of course, most people are neither NIMBYs nor YIMBYs per se: they will support some types of development, and oppose others. But questions of the above type are nonetheless helpful to tease out general default attitudes, and ‘NIMBY’ and ‘YIMBY’ are useful labels for those attitudes.
On the first question, on average, 56% of respondents supported housebuilding, and 31% opposed. So at least in the abstract, YIMBYs were the majority.
But even on the second question, the share of respondents who supported housebuilding in their local area was, on average, 47%, and the share who opposed it was 43%, indicating a relative YIMBY majority. At the very least, NIMBYs and YIMBYs were comparable in strength, and pandering to the YIMBY vote should have been no less electorally viable as pandering to the NIMBY vote.
Except – until the end of 2024, there was no such thing as ‘the YIMBY vote’. The crucial difference between the two camps was that the NIMBYs acted upon their political preferences, while the YIMBYs did not. The problem was not that politicians faced a NIMBY backlash every time they tried to get houses built. The problem was that there was never an equivalent, supportive reaction from the other side. This is what made housebuilding electorally unviable. There was a lot of anger over the housing situation, but that anger never manifested itself in the form of support for YIMBY policies. Whether the YIMBY–NIMBY split is 50:50, 60:40 or 90:10, it is irrelevant as long as only the NIMBY side acts, in political terms. The YIMBY side might then as well not exist at all.
So, understandably, when policymakers promised to grasp the nettle after the 2024 general election, few took their ‘this time is different’ rhetoric seriously.
But this time was different.
Britain’s housing revolution: how it happened
After the 2024 general election, the government did what governments often do when they want to kick an issue into the long grass: they set up an expert commission to investigate it. While the Housing Commission enjoyed bipartisan support and a high degree of professional respect, critics, quite understandably, asked why we needed yet another commission to tell us what we already knew.
In the first few weeks after the election, there were only two nods in a general pro-YIMBY direction: the composition of the Housing Commission had a clear pro-YIMBY bias, and the new Housing Secretary, a relatively unknown last-minute appointment, had solid YIMBY credentials. But none of this was new: we had been there before, and it had not led to any meaningful policy changes.
In December 2024, the new Housing Secretary announced the first tangible policy changes, albeit very unimaginative ones, which remained wholly stuck within the logic of the existing system: a reintroduction of mandatory housing targets, and a ramping up of the numbers. Until 2022, housing targets had been one of the few tools the national government had at its disposal to limit the worst excesses of NIMBY obstructionism at the local level. ‘Housing targets’ is a slightly unfortunate term because it is reminiscent of Soviet tractor production. But it never meant anything like that: it was simply a number of homes which local authorities were expected to approve, against the will of their local NIMBYs if necessary.
Those targets, however, did not make the NIMBY resistance go away; they just redirected it against the targets themselves. Consequently, in 2022, the targets were made ‘advisory’, which, for all intents and purposes, meant their abolition.
The decision to bring them back, and to ramp up the numbers, triggered the usual angry NIMBY backlash, especially in the South East of England. But unlike on previous occasions, in December 2024, this time, something else happened alongside: there was also an outpouring of public support. Although millions of people hated the policy, there were about as many who approved of it, and who, crucially, expressed that approval publicly. They expressed it, for example, on social media, in polls and in focus group interviews. The Housing Secretary’s popularity ratings rose, and soon surpassed those of every other member of the cabinet – including the Prime Minister’s.
Documents that were leaked years later have since shown that in December 2024 the prime minister was already planning to do what prime ministers usually do when faced with NIMBY opposition: capitulate, U-turn, demote the Housing Secretary, scrap the policy, apologise to the NIMBYs and build nothing. But the YIMBY awakening changed everything. It would have been difficult to present the most popular member of the cabinet as an electoral liability.
Emboldened by this new-found popularity, the Housing Secretary began to thrive in the role of an anti-NIMBY culture warrior, who, far from seeking compromise or accommodation, openly sought confrontation with NIMBYs, teasing and taunting them at every opportunity. The ensuing controversies energised the hitherto dormant ‘YIMBY bloc’ even further.
For the first time, YIMBYism became an actual electoral force. It is not that millions of people had suddenly become urban planning geeks, who avidly awaited the next edition of the Journal of Urban Economics or Land Economics. It was just that all that anger about the housing situation, which had hitherto been unfocused and poorly articulated, suddenly found an outlet. People stuck in substandard accommodation started to blame NIMBYs for their situation, when they would previously just not have seen any connection between the state of the housing market and campaigns to block housebuilding. YIMBY-vs-NIMBY became akin to a culture war issue, much like woke-vs-anti-woke, which meant that sitting on the fence was not an option. The government was forced to pick a side, and somewhat reluctantly, they decided to throw in their lot with the YIMBYs.
But while the Housing Secretary’s rhetoric was aggressively anti-NIMBY, treating them as an enemy to be defeated rather than opponent to be won over, the government’s actual policy was a lot more pragmatic than that. From 2025 onwards, the government began to experiment with a raft of financial incentive schemes to make housebuilding more palatable to local residents. The mechanics of the schemes differed, but most of them were variations of the same simple idea.
When planning permission for a plot of land is granted, the value of that plot of land multiplies. This so-called ‘planning gain’ or ‘planning uplift’ remains substantial even today, but in the mid-2020s, when Britain was starved of residential land, it was colossal. The ability to grant planning permission was like a licence to print money.
In hindsight, it seems bizarre that local authorities used to be so reluctant to make use of their ‘money-printing’ abilities. But the problem was that the money which was ‘printed’ in that way only accrued to a small number of people – mainly the landowners – while (to stay within the metaphor for a moment) everyone else had to listen to the annoying rattling noise of the printing press. Thus, many residents hated it, and those were the ones local authorities usually listened to.
The idea of spreading the planning gain more widely, and thereby making development more popular, was age-old, and seemingly obvious. But it was only in 2025 that Britain started to systematically make use of it. This started with a substantial increase in the Infrastructure Levy, which was a tax on the planning gain that was already being rolled out, as a replacement of previous ad-hoc charges. The original purpose of the levy was to finance additional infrastructure needs resulting from development, thus making development self-financing. The new and extended purpose was to make sure that development was not only cost-neutral, but also a net fiscal gain for communities, which would then be able to use that net gain as they saw fit: they could, for example, slash council tax for a year or two, or fund an upgrade of local amenities.
The year 2025 also saw the mass roll-out of Community Land Auctions, under which councils buy land from local landowners, grant themselves planning permission, and then auction off that land to developers, capturing a large chunk of the planning gain in the process (Leunig 2011). They could then, again, use that windfall gain for some combination of local tax cuts and additional investment.
In addition, there were various forms of direct compensation payments from developers or landowners to local residents who were most affected by proposed development projects. This was based on a proposal by Pennington (2002) from decades earlier, and the idea was to bypass local politics altogether.
There was also a more general rebalancing of the tax system towards the local level. The UK used to be unusually centralised for a country of its size. Over 90% of tax revenue was collected by the national government, compared with 83% in France, 72% in Spain, 67% in Sweden, 63% in Germany, 55% in the US, and only marginally over 50% in Switzerland (OECD 2022e). Broadly speaking, in countries with greater fiscal autonomy at the local and/or regional level, local and/or regional governments try to attract taxpayers, because more taxpayers means more tax revenue. One obvious way to do that is to allow housebuilding. In Britain, on the other hand, local governments were more likely to see newcomers as hostile invaders to be fought off.
This changed from 2025 onwards, when local governments were given greater tax-raising powers, while central government grants and national taxes were cut commensurately. For example, a proportion (initially small) of income tax was diverted to the local area, and this proportion was subsequently converted into a proper local income tax, clearly separate from national income tax.
With increased self-reliance of local governments came additional autonomy and flexibility. Central government grants come with strings attached; locally raised revenue does not. This made it much easier for local governments to react to the challenges presented by additional housing. They could now deliver the full package of additional infrastructure, additional public services and additional amenities.
Taken together, these fiscal changes meant that people who lived in places which allowed lots of housing development would see material improvements in their living standards, changing financial incentives decidedly in a pro-development direction. This had an ambivalent effect on NIMBYism: it made some people ‘more NIMBY’, and others less so. The more ideological NIMBYs felt insulted by what they perceived as a ‘bribe’, and resented the implication that they could be ‘bought off’. Yet the more transactional NIMBYs saw it as a fair compensation for the inconvenience. YIMBYs and agnostics, meanwhile, tended to see it as free money.
So, while the original assumption that NIMBYs were rational actors who could be won over turned out to be illusory, changing incentives was still the right thing to do, on balance. It split the NIMBY coalition, and it turned politically passive YIMBYs into more active ones.
In late 2025, the Housing Commission released its report. As critics had suspected, it did not come up with anything fundamentally novel: it was more like a ‘Greatest Hits’ album of YIMBYism. But it was nonetheless useful, because unlike previous reports of its kind, this one fell on fertile ground. It is not that many people read the full report, but it received high levels of media coverage, and on the back of it, several of its lead authors became regular, sought-after media commentators on housing-related issues. This ensured a continuous presence of an academic YIMBY voice in the debate.
In 2026 the government started to implement several of the report’s recommendations.
The first major policy was the selective granting of planning permission on greenbelt land within a walkable radius around commuter stations, provided that that land was not especially green anyway. This idea had first been expressed by Prof Paul Cheshire of the London School of Economics in 20146, and fleshed out in much greater detail five years later (Cheshire and Buyuklieva 2019). Cheshire had shown that if this was done around just five cities (London, Birmingham, Manchester, Newcastle and Bristol), it would be possible to increase the country’s housing stock by at least 7%, while using up less than 2% of the total greenbelt area.
Anticipating that the NIMBY backlash would be extreme anyway irrespective of the details, the government adopted a might-as-well-be-hanged-for-a-sheep-as-a-lamb approach, and went beyond the original Cheshire plan by extending it to all greenbelts, including those around Oxford and Cambridge. This move was accompanied by a clever PR campaign, which endlessly hammered home the message that much of the greenbelt was not literally green, and which illustrated this with striking images of ugly greenbelt land. Mostly as a publicity stunt, the government also officially renamed greenbelts into ‘urban growth boundaries’, which is what they are called in other English-speaking countries. This was widely ridiculed, and, unsurprisingly, it had no real effect on everyday language: to this day, people still call them ‘greenbelts’ rather than ‘urban growth boundaries’. But in mocking the name change, critics talked about it, and thereby inadvertently helped to spread the argument the government was trying to make: that ‘greenbelt’ is a misnomer bordering on false advertisement.
Even so, the government accepted that they would lose a few marginal seats over this. Their hope was simply that, even though the policy itself may be wildly unpopular, its eventual results would compensate for that. It was an upfront investment of political capital, which, they hoped, would pay off over time.
The second recommendation from the report which was implemented in 2026 was the automatic granting of planning permission for medium-density, mid-rise development on virtually all golf courses in the country. This was indirectly inspired by the aforementioned Prof Paul Cheshire, who had argued in 2014:
“Greenbelts are a handsome subsidy to ‘horseyculture’ and golf. Since our planning system prevents housing competing, land for golf courses stays very cheap. More of Surrey is now under golf courses […] than has houses on it.” (Cheshire 2014: 17)
Prof Cheshire had not drawn any specific policy conclusion from this, but the automatic granting of planning permission was entirely consistent with his criticism, because it was simply a removal of that implicit subsidy. Opponents were, again, furious, but they could not protest this measure without coming across as if they were prioritising the hobbies of the rich over the housing needs of ordinary people.
Thirdly, the government began to roll out ‘Street Votes’, a proposal to densify existing neighbourhoods initially developed by Ben Southwood and Samuel Hughes (2021). Under this proposal, the residents of an individual street can, in effect, collectively opt out of the planning system, and grant themselves incremental development rights, for example for building additional storeys on top. The incremental planning gain that is realised in this way is just as valuable as the original planning gain that is realised when agricultural land is converted into residential land.
In an even more direct way than the aforementioned Infrastructure Levy, Community Land Auctions, direct compensation payments and so on, this meant that the people who had the power to grant planning permission were also the ones who benefited from the planning gain.
The Street Votes scheme was accompanied by an equivalent scheme for social housing estates, ‘Estate Votes’, which was really a mass roll-out of something that was already happening sporadically. Under this scheme, social housing associations can draw up regeneration plans for an estate, and put them to a vote among the residents, or alternatively, the residents can also initiate such plans themselves. In either case, the original estate is demolished, and a new, more modern one is built in its stead. The residents are guaranteed alternative accommodation elsewhere, which must be of an equivalent or higher standard, and under equivalent or better conditions. Once the building works have been completed, tenants can choose between either staying in the alternative accommodation, or moving back to the original site, into an at least equivalent flat in the new estate. The new estate, crucially, contains many more housing units than the old one. The additional ones can be rented out or sold at market rates, which is how those regeneration schemes finance themselves. As with Street Votes, such plans can only go ahead if a majority of the affected tenants vote for them. Social housing associations can, however, offer additional financial compensation payments to tenants.
2027 saw a revival of the New Towns policy, which had made a major contribution to housebuilding in the quarter-century or so after World War II. This was, again, not a new idea. In 2014 a report by the Confederation of British Industry had already argued:
“To support a step-change in supply, we will […] need to see extensive progress made on delivering new towns and garden cities, supported by appropriate investment in new economic and social infrastructure. […] [I]n London, the South East and the East, we […] require the construction of 2 Ebbsfleet-sized new towns or garden cities every year to meet and exceed rising demand.” (CBI 2014: 23)
The CBI called for ‘[c]ommitment to building new towns and garden cities, with development completed or underway for ten new communities by 2025’ (CBI 2014: 5).
The New Towns Act 2027 finally paved the way for a version of that. The historic predecessor was by no means an unblemished success story, but the planners of the post-2027 ‘New New Towns’ tried hard to avoid the mistakes of the earlier waves. Anything that looked remotely reminiscent of ‘brutalist’ architecture was shunned, and there was an emphasis on mixed-use, walkability and connectivity. The biggest difference, though, is that the New New Towns are, in the main, capitalist ventures. They are not the projects of town planning bureaucrats, imposing their idea of how other people should live. They are projects of private investors who have ‘skin in the game’. They can lose a lot of money if things go wrong, and some of them probably will.
Later in 2027 the government went back to a White Paper from seven years earlier (MHCLG 2020), which had been prematurely shelved after some initial resistance. Its main idea had been to replace Britain’s discretionary planning system with a rules-based one. This means that, rather than haggling over each individual planning proposal, planning authorities should spell out in advance what could be built where. Building applications that complied with these pre-specified criteria (the ‘zoning code’) would then get near-automatic approval, or at least, they could not be refused on a whim.
Rules-based systems are not per se more permissive than discretionary ones. A zoning code could, in extremis, say that all development everywhere is banned, with no further negotiations allowed. That would be a ‘rules-based system’, because ‘all development everywhere is banned’ is a rule. In fact, Britain’s old planning system used to have one major zoning element: greenbelts.
However, when Britain’s transition from a discretionary planning system to a rules-based zoning system finally began in 2027, this happened in a more development-friendly fiscal context, and a more YIMBY-friendly political climate, than would have been the case in 2020/21. The transition happened slowly because it meant that detailed local plans and design codes had to be drawn up everywhere, and at the time of writing, it is still not fully complete. But where the new system is in operation, it is substantially more permissive than the discretionary planning system it replaced.
Demand-side measures played their part as well. In the beginning of 2028, the government abolished Stamp Duty Land Tax without replacement. Under different circumstances, this might not have had much of an impact in the short term, but in 2028 it very much did. The construction boom had not really begun yet, but expectations had already adjusted. People who had toyed with the idea of downsizing, but who had held on to their property in the hope of future increases in value, realised that the time of ever-increasing property prices was over, and that the time to sell was now.
There was even a one-off exodus of people who sold their houses for a small fortune while they still could, and then retired to much larger properties on the Mediterranean coast. In this way, Britain received an advance on its future housing boom: it was as if people could already move into houses that had not been built yet.
Immigration remained well below projected levels throughout. A few months before the 2024 election the then government had hiked the minimum salary threshold for people applying for a work visa from £26,200 to £38,700 per annum, which led to a major reduction in immigration from the second half of 2024 onwards. Despite frequent complaints about labour shortages, the government decided to uprate that salary threshold in line with real wage growth every year from 2025 on, thus keeping a lid on immigration numbers. They did so purely for pragmatic reasons, rather than out of genuine conviction: housebuilding is an even harder sell, electorally, if NIMBYs can weaponise anti-immigration sentiments, telling people that none of the hated development would be necessary if immigration were cut instead.
Otherwise, throughout 2028 and 2029 the government concentrated on complementary reforms to accommodate the growing housing supply, and on offsetting reforms to preserve the countryside in other ways. The former meant an expansion in infrastructure, energy and water supply. The latter meant a flurry of rewilding and reforestation projects.
After 2029 the focus shifted from big-bang reforms to smaller-scale initiatives, none of which delivered more than a few thousand homes on their own, but which all kept adding up.
This is an ongoing process. Britain’s housing revolution is work in progress. It is unclear where it will go next, but it is safe to say that it will neither go backwards, nor stop here. The disagreements are now about how, not whether, to proceed.
Conclusion
Given that Britain’s housing revolution was such an unambiguous success story, it now seems hard to believe that it was initially extremely polarising, and wildly unpopular with millions of people. Today, the ‘continuity NIMBYs’ who still have not come to terms with it look like the equivalent of the ‘Japanese holdout’, those scattered Japanese army units who, in their minds, still kept fighting World War II, long after the Japanese Empire had ceased to exist. The far more common attitude among former NIMBYs, though, is to pretend that they have always supported the housing revolution.
Different parts of the political spectrum now try to claim it as ‘theirs’. The then government now glosses over how divided they were over it until recently. The then opposition now tells a version of events in which it had really been their initiative all along, and in which they had to prod, push, shove and cajole an unwilling government.
Different aspects of the housing revolution appeal to different parts of the political spectrum. The Left likes its egalitarian aspects: the benefits of the housing revolution have been systematically biased in favour of people in the bottom half of the income distribution. It has made Britain a more equal country in terms of its wealth distribution, and in terms of its income distribution if we look at incomes on an after-housing-costs basis. The political Right likes the increase in home ownership, and the fact that it has made Britain a more family-friendly country. Economic liberals like the increased economic dynamism, the mobility, the productivity improvements and the fiscal savings that resulted from the removal of what they see as the dead hand of government.
There are plenty of lessons to be learned from this policy experiment. What will fascinate future historians most, though, is not the question of why and how Britain’s housing revolution happened, but the question of why it did not happen in the 10, 20, 30 or 40 years leading up to 2024.
Why did Britain ever inflict this crisis upon itself? Why did this country so needlessly impoverish itself for so long? Why did Britain ever give so much power to a minority of obstructionists and troublemakers?
The housing revolution was ultimately just applied A-level economics. The real mystery is why it was ever necessary.
About the author
Dr Kristian Niemietz is the IEA’s Editorial Director. He studied Economics at the Humboldt University Berlin and the University of Salamanca, graduating in 2007 as Diplom-Volkswirt (≈MSc in Economics). In 2013, he completed a PhD in Political Economy at King’s College London.
He is the author of the books A New Understanding of Poverty (2011), Redefining the Poverty Debate (2012), Universal Healthcare Without the NHS (2016) and Socialism: The Failed Idea That Never Dies (2019).
PDF Viewer
References
Barker, K. (2003) Review of housing supply. Interim Report – Analysis Securing our Future Housing Needs. London: HM Treasury.
Barker, K. (2004) Review of housing supply. Final Report – Recommendations. London: HM Treasury.
Boles, N. (2013) Housing the next generation. Speech by Planning Minister Nick Boles at an event hosted by Policy Exchange (https://www.gov.uk/government/speeches/housing-the-next-generation).
Brueckner, J. (1990) Growth controls and land values in an open city. Land Economics 66(3): 237–48.
CBI. (2014) Housing Britain: Building new homes for growth. London: Confederation of British Industry.
Cheshire, P. (2014) Turning houses into gold: The failure of British planning. CentrePiece 19(1): 14–18.
Cheshire, P. and Buyuklieva, B. (2019) Homes on the right tracks: Greening the Green Belt to solve the housing crisis. London: Centre for Cities.
Cheshire, P., Hilber, C. and Kaplanis, I. (2011) Evaluating the effects of planning policies on the retail sector: Or do Town Centre First policies deliver the goods? SERC Discussion Paper 66. London: Spatial Economics Research Centre, London School of Economics.
Corlett, A. and Odamtten, F. (2021) Hope to buy: The decline of youth home ownership. London: Resolution Foundation.
Dawkins, C. and Nelson A. (2002) Urban containment policies and housing prices: An international comparison with implications for future research. Land Use Policy 19: 1–12.
DCLG (2017) Fixing our broken housing market. London: Department for Communities and Local Government.
DLUHC (2022) Land use statistics: England 2022. London: Department for Levelling Up, Housing and Communities (https://www.gov.uk/government/statistics/land-use-in-england-2022).
DLUHC and MHCLG (2022a) Housebuilding: Permanent dwellings started and completed, by tenure and region, quarterly. Live tables on housing supply: indicators of new supply. Table 217. London: Department for Levelling Up, Housing and Communities and Ministry of Housing, Communities & Local Government.
DLUHC and MHCLG (2022b) Numbers of households on local authorities’ housing waiting lists by district: England, 31 March 1987-2021. Live Table 600. London: Department for Levelling Up, Housing and Communities and Ministry of Housing, Communities & Local Government (https://www.gov.uk/government/statistical-data-sets/live-tables-on-rents-lettings-and-tenancies).
DLUHC and ONS (2021) English housing survey 2020-21: Headline report and annex tables. London: Department for Levelling Up, Housing and Communities & Office for National Statistics (https://www.gov.uk/government/statistics/english-housing-survey-2020-to-2021-headline-report).
European Commission (n.d.) EU buildings factsheets (https://ec.europa.eu/energy/eu-buildings-factsheets_en).
Eurostat (2024) 2023 current market rents obtained through surveys with estate agencies, covering a specific housing segment
(https://ec.europa.eu/eurostat/documents/6939681/7243182/Ares%282023%298073026+Booklet_2024_rents_2023_e_Final.pdf/e9d50b9f-911c-ca5f-7161-1adc03cb7598?t=1701095269033).
Eurostat (2022) 2021 current market rents obtained through surveys with estate agencies, covering a specific housing segment (https://ec.europa.eu/eurostat/documents/6939681/7243182/Booklet_2022_rents_2021_e_FINAL.pdf/a245ad6c-64bc-bc37-9828-918805ba2530).
Evans, A. (1988) No room! No room! The costs of the British town and country planning system. IEA Discussion Paper 79. London: Institute of Economic Affairs (https://iea.org.uk/publications/research/no-room-no-room-the-costs-of-the-british-town-and-country-planning-system).
Hilber, C. and Vermeulen, W. (2014) The impact of supply constraints on house prices in England. The Economic Journal 126(591): 358–405.
IFS (2022) Living standards, inequality and poverty spreadsheet. London: Institute for Fiscal Studies (https://ifs.org.uk/living-standards-poverty-and-inequality-uk).
Leunig (2011) Community Land Auctions: working towards implementation. London: CentreForum. (https://yimbyalliance.org/wp-content/uploads/2024/01/Community-land-auctions-working-towards-implementation.pdf). MHCLG (2020) Planning for the future. White Paper August 2020. London: Ministry of Housing, Communities and Local Government (https://www.gov.uk/government/consultations/planning-for-the-future).
Milburn, K. (2019) Generation Left. Cambridge and Oxford: Polity Press.
Niemietz K. (2021) Left turn ahead. Surveying attitudes of young people towards capitalism and socialism. IEA Current Controversies Paper 81. London: Institute of Economic Affairs (https://iea.org.uk/publications/left-turn-aheadsurveying-attitudes-of-young-people-towards-capitalism-and-socialism/).
OECD (2022a) Housing stock and construction. Housing market context indicators. (https://www.oecd.org/housing/data/affordable-housing-database/housing-market.htm).
OECD (2022b) Real house price indices. Analytical house prices indicators. (https://stats.oecd.org/Index.aspx?DataSetCode=HOUSE_PRICES).
OECD (2022c) Social rental housing stock. PH4.2 Public policies towards affordable housing. Database (https://www.oecd.org/els/family/PH4-2-Social-rental-housing-stock.pdf).
OECD (2022d) Public spending on housing allowance as % of GDP. PH3.1. Public policies towards affordable housing. Database (https://www.oecd.org/housing/data/affordable-housing-database/housing-policies.htm).
OECD (2022e) Consolidated government revenue as percentage of total general government revenue (consolidated) [Table 7: 1970 – 2020]. Fiscal Decentralisation Database (https://www.oecd.org/tax/federalism/fiscal-decentralisation-database/).
ONS (2018) Regional economic activity by gross value added (balanced), UK: 1998 to 2017 (https://www.ons.gov.uk/economy/grossvalueaddedgva/bulletins/regionalgrossvalueaddedbalanceduk/1998to2017).
ONS (2021a) Percentage of total monthly household income spent on private rent, England, Financial Year Ending 2013 to 2020.
ONS (2021b) Regional gross disposable household income, UK: 1997 to 2019 (https://www.ons.gov.uk/economy/regionalaccounts/grossdisposablehouseholdincome/bulletins/regionalgrossdisposablehouseholdincomegdhi/1997to2019).
ONS (2022) Age of the property is the biggest single factor in energy efficiency of homes. (https://www.ons.gov.uk/peoplepopulationandcommunity/housing/articles/ageofthepropertyisthebiggestsinglefactorinenergyefficiencyofhomes/2021-11-01).z
ONS (2023) Housing affordability in England and Wales: 2022
(https://www.ons.gov.uk/peoplepopulationandcommunity/housing/bulletins/housingaffordabilityinenglandandwales/2022).
Our World in Data (2022a) Agricultural land use (https://ourworldindata.org/grapher/agricultural-land?tab=chart&country=~GBR).
Our World in Data (2022b) Deforestation and forest loss
(https://ourworldindata.org/deforestation#global-deforestation-peaked-in-the-1980s-can-we-bring-it-to-an-end).
Pennington, M. (2002) Liberating the Land: The Case for Private Land-Use Planning. London: Institute of Economic Affairs.
Quigley, J. and Raphael, S. (2001) The economics of homelessness: The evidence from North America. European Journal of Housing Policy 1(3): 323–36.
Rankl, F. and Barton, C. (2022) Green belt. Research Briefing. London: House of Commons Library.
Southwood, B. and Hughes, S. (2021) Strong suburbs: Enabling streets to control their own development. London: Policy Exchange.
Statista (2023) Rental prices of prime office properties in selected European cities from 2021 to 2022 (in euros per square meter per year) (https://www.statista.com/statistics/431672/commercial-property-prime-rents-europe/).
Watling, S. (2023) Why Britain doesn’t build. Works in Progress 11 (https://worksinprogress.co/issue/why-britain-doesnt-build/).
Watling, S. and Breach, A. (2023) The housebuilding crisis. The UK’s 4 million missing homes. London: Centre for Cities.
World Population Review (2023) House size by country 2024 (https://worldpopulationreview.com/country-rankings/house-size-by-country).
Footnotes
- Lamont, D. (2021) ‘What 175 years of data tell us about house price affordability in the UK’, Schroders, 20 February 2023 (https://www.schroders.com/en-gb/uk/individual/insights/what-174-years-of-data-tell-us-about-house-price-affordability-in-the-uk/). Lamont uses the mean rather than the median, so his figures are not identical to those of the ONS. But they are not far off, and, in any case, it is the time trend rather than the exact figure in any given year that is of interest here.
- Lab space shortage threatens life science boom in Oxford and Cambridge’, Financial Times, 1 August 2022 (https://www.ft.com/content/397a75aa-3047-432e-8664-d1974fbb05df).
- ‘How Britain voted in 2010’, Ipsos, 21 May 2010 (https://www.ipsos.com/en-uk/how-britain-voted-2010).
- YouGov Support for increased house building. Accessed: 5 March 2024
(https://yougov.co.uk/topics/politics/trackers/support-for-increased-house-building) - YouGov Support for increased house building in your LOCAL area. Accessed:
5 March 2024 (https://yougov.co.uk/topics/politics/trackers/support-for-increased-house-building-in-your-local-area) - Cheshire, P. ‘Building on Greenbelt land: So where?’, CEP Urban and Spatial Programme, Centre for Economic Performance. London School of Economics, 9 July 2014 (http://spatial-economics.blogspot.com/2014/07/building-on-greenbelt-land-so-where.html).
SHARE


