How the UN gets poverty wrong? (Part 2)
SUGGESTED

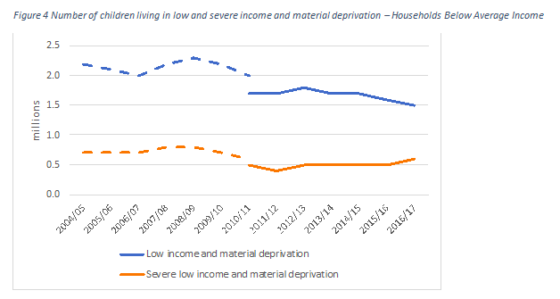
Furthermore, the condition of poverty is not uniform and some will endure more hardship than others. HBAI data do allow us to make some distinctions. 1.5 million children are classified as living in conditions of low income and material deprivation in 2016/17 (before housing costs). That is 11 per cent. The corresponding numbers in 2004/5 were 2.2 million and 17 per cent.
HBAI further classifies those children deemed to be in severe low income and material deprivation. On this measure there are 0.6 million children or 4 per cent in 2016/17, down from 0.7 million and 6 per cent respectively in 2004/5 (note that these figures are based on relative low-income as well as measures of material deprivation; changes were made in the way deprivation was measured in 2010, meaning long-term change should not be overstated).
Figure 4: Number of children living in low and severe income and material deprivation – Households Below Average Income
It is also true that here in the United Kingdom we have one of the lowest rates of persistent poverty in the European Union. While it has declined from 8.5 per cent in 2008 to 7.3 per cent in 2015, the EU average has risen from 8.7 to 10.9 per cent.
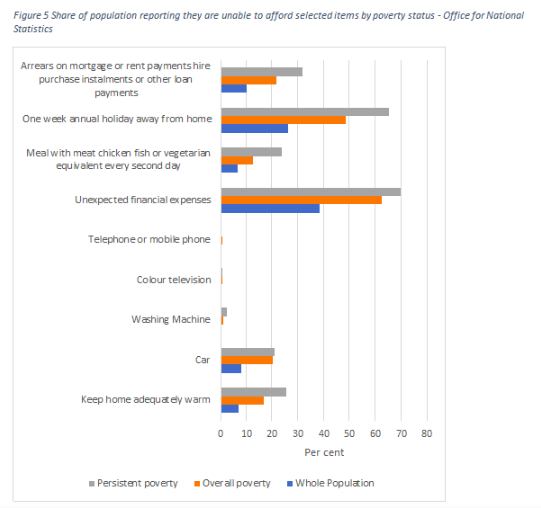
Of those in poverty as measured by the ONS, it is only a minority that struggle to heat their homes (17 per cent) or buy a car (20 per cent). A tiny percentage cannot afford a washing machine, colour television or mobile phone. In fact, just 49 per cent of those in poverty said they could not afford a one-week annual holiday. The experience of poverty in the United Kingdom is largely defined by the inability to cope with unexpected financial pressures, not want for basic goods – 63 per cent of those classified as in poverty said they could not afford unexpected financial expenses.
Figure 5: Share of population reporting they are unable to afford selected items by poverty status – Office for National Statistics
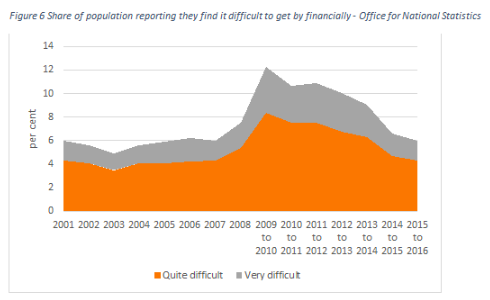
In fact, ONS statistics reveal the share of people who say they are struggling to get by financially is 6 per cent as of 2015/16. 4 per cent say they find it quite difficult while 2 per cent say it is very difficult. As seen in the graph below, the proportion went up with the financial crisis to 12 per cent (8 per cent quite, 4 per cent very) and since then it has been declining.
How is it we can talk in good conscience about one fifth being in poverty, given this evidence? Is it not time to name the official poverty statistics for what they are – measures of low pay? Also, note how both the relative and absolute measurements do not pick up the rise in hardship to the same extent as these data.
Figure 6: Share of population reporting they find it difficult to get by financially – Office for National Statistics
Nowhere in his statement does Professor Alston tell you about such things, yet claims: ‘To address poverty systematically and effectively it is essential to know its extent and character. Yet the United Kingdom does not have an official measure of poverty. It produces four different measures of people who live on “below average income.” This allows it to pick and choose which numbers to use and to claim that “absolute poverty” is falling.’
Note again the use of quotation marks. Professor Alston then goes on to do exactly what he accuses the government of doing. He proceeds to pick and choose which numbers to use – a measure of relative poverty which allows him to claim that poverty among children is rising.
He tries to disguise his cherry-picking of the evidence by using a new measure of poverty proposed by the Social Metrics Commission, which is actually just another measurement of relative poverty plus some indicators of the cost of living, and produces little difference from the standard relative measurement. He claims because this organisation is “bi-partisan” it has produced a “single measure” but it does not allow us to take into account those very real material improvements in the lives of the poorest because it is still just a relative measurement.
The absence of absolute poverty rates (whatever their limitations), in our national conversation on poverty is a scandal. Surely it is now time to ask: who benefits from a favoured measure of poverty that never budges meaningfully? How can government anti-poverty programmes be measured against a yardstick that is constantly rising? How can we have a measurement that we could never realistically imagine reaching zero? Is it not a recipe for endless tax-payer funded, government and civil society interventions that are never expected to actually help people?
It is almost as if these absolute poverty statistics are non-statistics, non-facts. This is evident even among apparently expert organisations on poverty. There is no mention of absolute poverty in the Joseph Rowntree Foundation’s supposedly authoritative UK Poverty 2017 report nor the Equality and Human Rights Commission’s Is Britain Fairer? report of this year. These are both flagship reports.
The Special Rapporteur’s poor grasp of research methodology is further underscored by his reliance on anecdotes. Throughout his statement he pours scorn on the Government for being out of touch with what is happening on the streets. He writes:
‘But there is a striking disconnect between what I heard from the government and what I consistently heard from many people directly, across the country. People I spoke with told me they have to choose between heating their homes, or eating and feeding their children… I also heard story after story from people who considered and even attempted suicide.’
If you deliberately go looking for poverty and hardship then you will find it. That does not mean to say you can repudiate absolute poverty statistics based on the stories of those people you have met, no matter how difficult things might have been for them. It is down to Professor Alston to substantiate these claims with genuine empirical evidence.
Part 3 will be out tomorrow.


