How the UN gets poverty wrong (Part 1)
22 November 2018
SUGGESTED
Economic Theory
21 November 2018

Labour Market
22 November 2018

Trade, Development, and Immigration
4 November 2024
A few years ago, when my grandfather was still alive, my father took him to see Angela’s Ashes at the cinema. Set in poverty-stricken Ireland in the 1930s and 40s, the film features a boy who wears boots made of car tyres. This scene reminded my grandfather of a boy he had known growing up in Arbroath, who also wore shoes made from tyres. I was reminded of this while reading the recent preliminary statement on poverty in Britain, by the UN Special Rapporteur on extreme poverty and human rights, Professor Philip Alston.
Today, the grandchildren of that boy in Arbroath will wear decent shoes or trainers. They will own televisions and smartphones, and access free education, healthcare, and affordable food. When clothes get damaged, they will not mend them, but buy new ones. Yet they might still be classed as living in poverty, despite huge advances made across generations, simply by having less than other families who have also made material gains.
This represents the conundrum of how we classify poverty. Is it an absolute phenomenon or a relative one? Poverty is measured in two ways in the UK. Respondents to the Households Below Average Incomes survey (HBAI) collected by the Department for Work and Pensions (DWP) are classified as being in ‘relative low-income’ if they live in households with incomes below 60 per cent of the median.
While we might assume absolute poverty would be measured in terms of access to basic goods and services, statisticians have not figured out a precise way of doing this and instead classify anyone living in households below 60 per cent of the median income in 2010/11 as being in absolute low-income. (Note the use of the term low-income rather than poverty as used in official statistics – the term ‘poverty’ comes later.)
There are then two further subdivisions of these measures which look at both absolute and relative low-incomes before and after housing costs are taken into account.
Which measure you adopt is a matter of debate and there are arguments for both. The main criticism of relative poverty measures is that they are unduly sensitive to the median income. All gains made by the poorest on this measure will not show up if the median income also rises, while in times of recession it can seem like fewer people are in poverty because the median drops. Comparing the incomes of the poorest against a fixed benchmark must surely be the most sensible way to measure poverty, but it is certainly wise to consider all the evidence.
Unfortunately, this was not the approach taken by the United Nation’s visiting Special Rapporteur. In his preliminary statement after his brief sojourn in the United Kingdom he writes, haughtily:
‘The government told me that there are 3.3 million more people in work than in 2010, that so-called “absolute poverty” is falling.’
Note the use of ‘so-called’ and quotation marks, such is his disdain for the mere concept – never mind the measurement.
Absolute poverty is a perfectly legitimate idea. Does the UN’s Special Rapporteur not realise, when he hears all the statistics pouring out of his employer about the share of the world’s population living below $1.25 a day, that this is a measure of absolute poverty?
Examining absolute poverty in this country, we see a remarkable story of success. In 1994/5, 41 per cent were living in absolute poverty compared to 19 per cent in 2016/17, a real achievement but not evidenced by the relative figures which have fluctuated without clear trend between 20 and 25 per cent. (Here, I am referring always to poverty figures after housing costs, unless stated.)
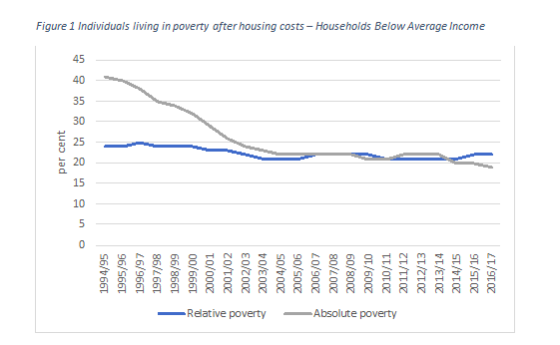
Figure 1: Individuals living in poverty after housing costs – Households Below Average Income

The lack of change is down to the fact that the relative poverty line in the United Kingdom is constantly rising, as seen in Figure 2, from £169 to £255 per week between 1994/5 and 2016/17. Observe how the relative poverty line dips during the recession and worst of the financial crisis and recovers from about 2013/14 onwards. The consensus is that poverty has stalled, and is actually rising for children and pensioners, but can largely be explained by the median reasserting itself as the economy recovers. Changes in relative poverty are slight and rarely are we told if they are statistically significant or not.
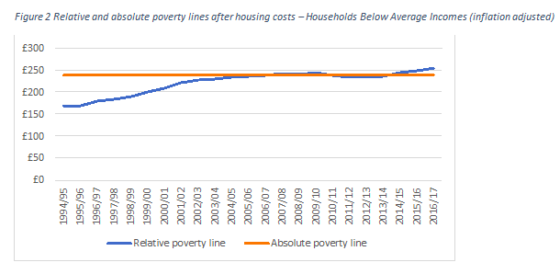
Figure 2: Relative and absolute poverty lines after housing costs – Households Below Average Incomes (inflation adjusted)

Nevertheless, it is true that progress on absolute poverty has slowed down. The more prescient criticism is not that things are getting worse but that things are not getting better as quickly as before – a far cry from the “solitary, poor, nasty, brutish, and short” Hobbesian state of nature to which Professor Alston believes the poor are doomed.
Delving deeper into the statistics reveals a number of startling successes. In 1994/95 there were 22.4 million people in absolute poverty. This has fallen to 12.4 million in 2016/17. Between 2010/11 and 2012/13, the figure rises from 13 million to 13.9 million as the Coalition Government takes over – then falls thereafter.
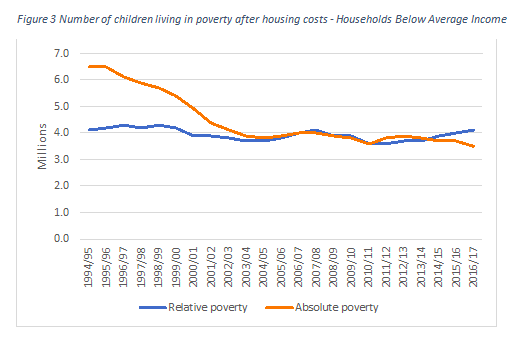
The number of children in absolute poverty declined from 6.5 million (51 per cent) to 3.5 million (26 per cent) between 1994/5 and 2016/17. Observe in Figure 3 below, how the number in relative poverty fluctuates without clear trend, regardless of the strength of the economy or who is occupying government.
Figure 3: Number of children living in poverty after housing costs – Households Below Average Income

Prof Alston’s claim that child poverty is not only rising, but projected to affect almost one in every two children, must be seen in this light.
Continue with Part 2 here.
Today, the grandchildren of that boy in Arbroath will wear decent shoes or trainers. They will own televisions and smartphones, and access free education, healthcare, and affordable food. When clothes get damaged, they will not mend them, but buy new ones. Yet they might still be classed as living in poverty, despite huge advances made across generations, simply by having less than other families who have also made material gains.
This represents the conundrum of how we classify poverty. Is it an absolute phenomenon or a relative one? Poverty is measured in two ways in the UK. Respondents to the Households Below Average Incomes survey (HBAI) collected by the Department for Work and Pensions (DWP) are classified as being in ‘relative low-income’ if they live in households with incomes below 60 per cent of the median.
While we might assume absolute poverty would be measured in terms of access to basic goods and services, statisticians have not figured out a precise way of doing this and instead classify anyone living in households below 60 per cent of the median income in 2010/11 as being in absolute low-income. (Note the use of the term low-income rather than poverty as used in official statistics – the term ‘poverty’ comes later.)
There are then two further subdivisions of these measures which look at both absolute and relative low-incomes before and after housing costs are taken into account.
Which measure you adopt is a matter of debate and there are arguments for both. The main criticism of relative poverty measures is that they are unduly sensitive to the median income. All gains made by the poorest on this measure will not show up if the median income also rises, while in times of recession it can seem like fewer people are in poverty because the median drops. Comparing the incomes of the poorest against a fixed benchmark must surely be the most sensible way to measure poverty, but it is certainly wise to consider all the evidence.
Unfortunately, this was not the approach taken by the United Nation’s visiting Special Rapporteur. In his preliminary statement after his brief sojourn in the United Kingdom he writes, haughtily:
‘The government told me that there are 3.3 million more people in work than in 2010, that so-called “absolute poverty” is falling.’
Note the use of ‘so-called’ and quotation marks, such is his disdain for the mere concept – never mind the measurement.
Absolute poverty is a perfectly legitimate idea. Does the UN’s Special Rapporteur not realise, when he hears all the statistics pouring out of his employer about the share of the world’s population living below $1.25 a day, that this is a measure of absolute poverty?
Examining absolute poverty in this country, we see a remarkable story of success. In 1994/5, 41 per cent were living in absolute poverty compared to 19 per cent in 2016/17, a real achievement but not evidenced by the relative figures which have fluctuated without clear trend between 20 and 25 per cent. (Here, I am referring always to poverty figures after housing costs, unless stated.)
Figure 1: Individuals living in poverty after housing costs – Households Below Average Income
The lack of change is down to the fact that the relative poverty line in the United Kingdom is constantly rising, as seen in Figure 2, from £169 to £255 per week between 1994/5 and 2016/17. Observe how the relative poverty line dips during the recession and worst of the financial crisis and recovers from about 2013/14 onwards. The consensus is that poverty has stalled, and is actually rising for children and pensioners, but can largely be explained by the median reasserting itself as the economy recovers. Changes in relative poverty are slight and rarely are we told if they are statistically significant or not.
Figure 2: Relative and absolute poverty lines after housing costs – Households Below Average Incomes (inflation adjusted)
Nevertheless, it is true that progress on absolute poverty has slowed down. The more prescient criticism is not that things are getting worse but that things are not getting better as quickly as before – a far cry from the “solitary, poor, nasty, brutish, and short” Hobbesian state of nature to which Professor Alston believes the poor are doomed.
Delving deeper into the statistics reveals a number of startling successes. In 1994/95 there were 22.4 million people in absolute poverty. This has fallen to 12.4 million in 2016/17. Between 2010/11 and 2012/13, the figure rises from 13 million to 13.9 million as the Coalition Government takes over – then falls thereafter.
The number of children in absolute poverty declined from 6.5 million (51 per cent) to 3.5 million (26 per cent) between 1994/5 and 2016/17. Observe in Figure 3 below, how the number in relative poverty fluctuates without clear trend, regardless of the strength of the economy or who is occupying government.
Figure 3: Number of children living in poverty after housing costs – Households Below Average Income
Prof Alston’s claim that child poverty is not only rising, but projected to affect almost one in every two children, must be seen in this light.
Continue with Part 2 here.
SHARE


