Has Brexit Really Harmed UK Trade? Countering the Office for Budget Responsibility’s claims
6 November 2023
SUGGESTED

Publications

Publications

Housing and Planning
https://iea.org.uk/wp-content/uploads/2023/11/Perspectives_5_corrected_web.pdf
This document has been updated since the print edition to reflect the government’s announcement that the ban on new petrol and diesel vehicles will be delayed until 2035.
This briefing note examines UK post-Brexit trade. Contrary to some media reports and many pre-Brexit assumptions, the data so far shows Brexit has not had a major impact on UK–EU trade. UK trade with EU countries has broadly moved in line with UK trade with non-EU countries, which should not have been the case if trade friction caused by Brexit had had a major impact on UK–EU trade. This is especially true when comparing EU and non-EU exports by industry sector, which my note Brexit and UK Trade – What Has Changed?1 discusses in detail.
Now that the worst Covid-related factory closures, component shortages and travel restrictions are over, it is possible to test the key assertion of those who argued that Brexit would damage the UK’s economy by examining whether UK–EU trade has decreased. If the Office for Budget Responsibility (OBR) is correct and the ‘exploitation of comparative advantage in trade has been significantly damaged’ by Brexit,2 then UK trade with the EU should be falling substantially compared to UK trade with other countries.
This paper does not claim there has been no impact on UK trade from Brexit. Although the UK and the EU have signed the Trade and Cooperation Agreement (TCA) granting each other tariff-free and quota-free trade, there will still be compliance costs of calculating Rules of Origin values, obeying Sanitary and Phytosanitary (SPS) regulations, and possible customs inspections. Whether these costs are prohibitive to trade will depend on the size of the exporting company, the proportion of goods they export to EU countries, and whether they exported to countries outside of the EU before Brexit, and so are familiar with the required processes and can easily absorb any additional costs.
While the UK was a member of the EU, taxpayers were paying for that membership. Among the beneficiaries were firms trading with the EU. These companies now have to pay for their own compliance when they trade with the EU as all companies do when they trade with non-EU countries. These costs will be either passed on to their customers as higher prices or absorbed as a business expense, but these costs will no longer be paid by all taxpayers.
As these additional costs are most likely to fall on small and medium sized enterprises (SMEs) unfamiliar with trade compliance, the Government set up an SME Brexit Support Fund in 20213 to teach SMEs how to comply with Customs, Rules of Origin and VAT processes. It is hoped that once SMEs have learnt to comply with EU customs processes, they will also have gained skills that will help them export to non-EU markets as well. However, from the UK–EU trade data so far, it is apparent that between 2019, the last full year of trade data before Brexit, and 2022, the most recent full year trade statistics:
1. Goods trade between the UK and EU does not show a Brexit effect.
If Brexit were a major disrupter of UK trade, we could expect to see a divergence between UK trade with EU destinations and UK trade with non-EU destinations. This is not the case. Office for National Statistics (ONS) trade data shows that trade flows by industry sector to EU and non-EU countries generally moved together. UK goods exports to EU countries increased by 13.5 per cent and to non-EU countries by 14.3 per cent between 2019 and 2022 (all commodities, current prices – see table 1).
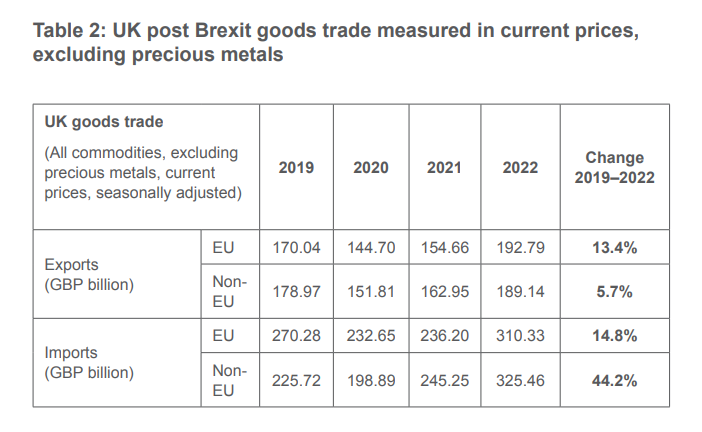
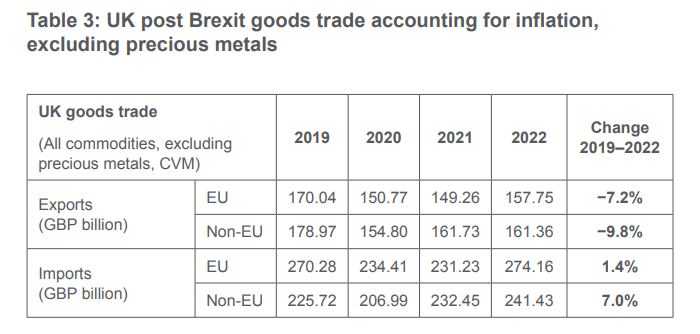
If we exclude precious metals, then exports to EU destinations increased by 13.4 per cent while exports to non-EU countries increased by only 5.7 per cent (see table 2), and if we use deflated data then exports to EU countries fell by 7.2 per cent but decreased by 9.8 per cent to non-EU countries (see table 3).4
2. Services trade between the UK and EU does not show a Brexit effect.
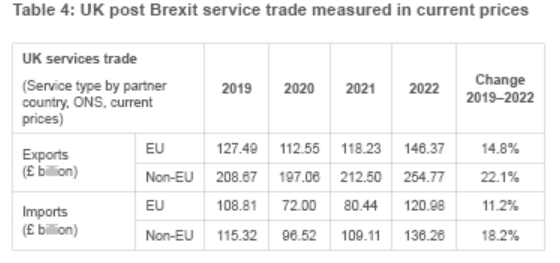
Service exports to the EU increased by 14.8 per cent from 2019 to 2022, and although total service trade with non-EU countries grew by more, there was wide variation between service industries (see table 4).5 Business services, telecommunications and intellectual property services all increased more to EU than to non-EU countries, while financial services, insurance and pensions, transport and travel services all increased more to non-EU countries. As exports are demand driven this is unlikely to be due to Brexit but simply due to varying rates of growth and requirements for different types of services in different export destinations.
3. The Brexit referendum vote did not disrupt EU/UK trade.
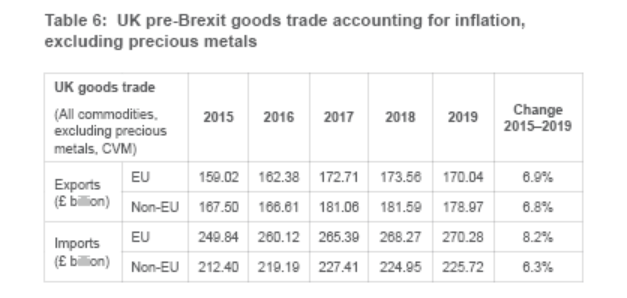
It has been suggested by the OBR that two fifths of the impact from Brexit on UK relative productivity occurred between the Brexit referendum in 2016 and the signing of the UK–EU TCA in December 2020, caused by lower investment which in turn caused lower trade. This is not apparent in the trade data: UK–EU trade continued to grow from 2015, before the Brexit referendum, until 2019, the last full year before the UK left the EU (see table 5).
4. Trade comparisons with other nations have not fundamentally changed.
While it has been claimed that the UK was at the bottom of the G7 for goods exports, this merely echoes the UK economy’s long-term trade patterns as it moved away from manufacturing to become a major service provider.6 Considering data from the past twenty years, the UK was generally the second smallest goods exporter in the G7 until 2021 when Canada’s commodity-based economy saw a boost from oil and gas exports that pushed it ahead of the UK (see graph 1). The UK’s general trade pattern has not fundamentally shifted since Brexit in comparison to other G7 countries; the UK is still the second largest service exporter in the G7 after the US.7
5. The OBR’s claim that Brexit will negatively impact the UK economy is not supported by trade data. The OBR’s chairman stated in October 2021 that leaving the EU would ‘reduce [the UK’s] long run GDP by around 4%’.8 The OBR’s April 2023 Brexit analysis claims that Brexit will reduce long-run productivity by 4 per cent relative to remaining in the EU and assumes that post-Brexit trade friction would cause both exports and imports to be 15 per cent lower in the long run than if the UK had remained in the EU.9 Neither claim is supported by the trade data so far. The UK and EU have a tariff-free and quota-free trade deal and the UK’s major exports have been unperturbed by trade friction between the UK and the EU.
The OBR also claimed that lower trade would be caused by lower investment in the UK due to Brexit uncertainty.10 However, if so, this also is not apparent in the trade data, and now that Brexit uncertainty has been removed, postponed investment in the UK economy is likely to be reinstated.
Taken together, the data indicates that Brexit has not negatively impacted UK–EU trade. The argument that Brexit might have some impact on the future level of UK–EU trade cannot be completely disproven, but any impact is extremely unlikely to be sufficient to see trade 15 per cent lower or productivity 4 per cent lower than if the UK had remained in the EU, as the OBR claimed it would. Indeed, more widely, given the rebound in post-Covid trade; the recent Free Trade Agreements (FTAs) with Australia, New Zealand and the Comprehensive and Progressive Agreement for Trans-Pacific Partnership (CPTPP); the ongoing trade negotiations with India and the Gulf Cooperation Council; and renegotiations of trade agreements with Canada, Mexico, South Korea, Switzerland and Turkey, as well as potential regulatory freedom which could improve UK competitiveness, Brexit overall should boost UK trade.
Further details on these points are given below:
Table 1 shows how goods trade has changed pre and post Brexit, between 2019 and 2022.11

Both EU and non-EU countries saw a large drop in trade in 2020 and 2021 due to Covid lockdowns, factory closures, key component shortages and international travel restrictions. UK trade with both EU and non-EU countries rebounded in 2022. From 2019 to 2022, goods exports to EU and non-EU destinations both grew by roughly 14 per cent for all commodities making a Brexit effect impossible to discern. The most substantial difference between UK trade with EU and non-EU countries was soaring fuel prices, which increased UK non-EU fuel imports by £55.5 billion between 2021 and 2022 as well as adding £19.9 billion to UK EU fuel exports.12
If we exclude precious metals from the trade figures, as is customary, goods exports to EU destinations have outperformed exports to non-EU destinations substantially, an increase of 13 per cent to the EU but only an increase of 6 per cent to non-EU countries. This makes any claims that Brexit has harmed UK trade with the EU look absurd.13

In addition, using the ONS’s Chained Volume Measures (CVM) to account for inflation, UK goods exports, excluding precious metals, fell by 7.2 per cent to EU countries between 2019 and 2022 but decreased by 9.8 per cent to non-EU countries (see table 3).14 This again makes it difficult to claim Brexit has hurt UK–EU trade.

Whether we look at all commodities or all commodities excluding precious metals, whether measured in current prices or by CVM, goods exports to the EU have performed as well or better than exports to non-EU countries since Brexit. In all measurements there has been an obvious shift in imports from non-EU countries, although this is in part due to increased gas imports from the three non-EU countries Norway, the US and Qatar.
If we delve deeper into individual export sectors, in most cases, UK exports to both EU and non-EU countries followed similar patterns, so any decline in exports in 2020/21 cannot be blamed on Brexit but was presumably due to other factors. These include Covid factory closures, key component shortages and lower international demand, or long-term reductions in UK production due to domestic regulations, higher costs or higher taxation.
The trade data also shows a greater diversity in trade with individual EU countries with UK exports increasing to some EU countries while decreasing to others. If Brexit trade friction were the cause of lower exports to the EU, it should have lowered trade to all EU destinations not just to some of them.
In the handful of cases where there were differences in EU and non-EU exports patterns this related to specific issues – most notably:
There are other issues that have changed UK trade statistics that have nothing to do with Brexit, most notably UK companies moving their factories to eastern EU countries or to Asian countries. For example, the British carmaker Jaguar Land Rover agreed to move its production of the new Land Rover Defender to Slovakia in December 201521 well before the Brexit referendum. The new factory opened in November 2018, 22 and this has turned many UK car exports to the EU into UK car imports from the EU. UK companies off-shoring their manufacturing started well before Brexit; the Financial Times was investigating factory relocations as long ago as 2010.23
Additionally, all petroleum product production has been falling in the UK since 2003, with oil and gas production in 2021 the lowest in 50 years,24 resulting in lower exports. Without looking at longer-term data, the fall in these exports since 2016 could be mistakenly blamed on Brexit although the decline started well before the Brexit referendum.
Brexit has also changed country level trade data because of changes in distribution management. For example, Belgium has become an EU distribution hub for UK pharmaceuticals. Its medicinal and pharmaceutical imports from the UK increased by 280 per cent between 2019 and 2022 making it the UK’s second largest EU market after Germany.25 But this has also caused exports to other EU markets to fall. For example, UK medicinal and pharmaceutical exports to Spain fell by 49 per cent and to Sweden by 44 per cent between 2019 and 2022.26
For these reasons, individual sector data should be analysed carefully and with full context, to determine whether Brexit has had any meaningful impact on UK trade.
Individual firms might be complaining about customs declarations or distribution issues – and these claims may be anecdotally valid. However, they do not reflect the bulk of UK trade and should not be thought of as showing wider trade patterns. Similarly, individual importers and exporters may face increased compliance costs but even trade with the EU was never entirely free. The costs were merely borne by the whole population in the form of the UK’s EU membership payments rather than by the individual importers or exporters who benefited directly from this subsidy.
Brexit does not appear to have had much effect on UK trade in services either. The ONS data indicates that between 2019 and 2022 exports in services rose faster than exports of goods to both the EU and to non-EU countries (although imports were the other way around). Trade in services thus far shows no significant Brexit effect.

Although service trade with the EU has not performed as well as service trade with the rest of the world, this varies greatly by the type of service and in most service sectors trade with the EU continued to grow between 2019 and 2022. 27
Seven service sectors made up 95 per cent of UK service exports in 2022. The UK’s largest service sector, Other Business Services, accounts for almost 40 per cent of UK total service exports, and business service exports to EU countries increased by 30 per cent between 2019 and 2022 while exports to non-EU countries rose by 26 per cent. Intellectual Property Service exports to EU countries were up by almost 50 per cent while they fell by 7 per cent to non-EU countries. And exports of Telecommunications, Computer and Information Services to EU countries were up by 38 per cent while exports to non-EU countries rose by only 31 per cent. Inversely, Insurance and Pension exports increased by 58 per cent to non-EU countries but by 45 per cent to EU countries. Travel exports between 2019 and 2022 increased by 26 per cent to non-EU countries but were up by only 11 per cent to EU countries, having dropped by 62 per cent in 2020 due to Covid travel restrictions. 28
The only exceptions were Financial Service exports that make up about 18 per cent of total service exports and were 4.5 per cent lower to the EU in 2022 than in 2019. However, this does not appear to be Brexit related, just normal market variations as EU exports were up 1.5 per cent in 2020 compared to 2019. Financial Service exports to the EU have been relatively flat for some years, increasing only 8 per cent between 2016 and 2022, while exports to non-EU countries increased by 33 per cent and are now worth twice as much as financial service exports to the EU.29
The other large service sector where exports to the EU are still below their 2019 levels was Transportation, which made up 7 per cent of the UK’s total service exports in 2022. Exports to the EU were 21 per cent below their 2019 level in 2022 although this is an improvement from their 49 per cent fall between 2019 and 2021 due to Covid. Transportation to non-EU countries has fully recovered since Covid and in 2022 was slightly above its 2019 value.
The remaining 5 per cent of total UK service exports, spread over five service sectors, have had varying results. Exports of some sectors have increased enormously to the EU since 2019, such as manufacturing services up 80%, while others such as Government Services exports to the EU were down 40 per cent and Personal, Cultural & Recreational Services exports to the EU were virtually unchanged. But these services are only worth a small absolute amount of total UK service trade and these large gyrations reflect the nature of these businesses rather than any Brexit-related trend.
Reviewing the trade data, it is hard to substantiate claims about a major negative Brexit effect on UK trade. Britain’s leaving of the European Union is not sufficient to overshadow the wider operation of trade. Trade flows largely relate to domestic industry structure, wider international and domestic economic factors, and technological or other exogenous factors. Exports are always demand driven. For example, it is likely that UK exports to Germany will be lower this year due to Germany’s recession, not Brexit.
A fair assessment of the impact of Brexit on trade should also consider trade flows in the immediate aftermath of the decision in 2016 to leave the EU. If Brexit did have a large negative impact on trade, this should have been evident in reduced trade volumes before 2019 in anticipation of a forthcoming breakup, as companies should have been preparing to reorientate their operations. In reality, the opposite happened. In 2015, before the Brexit vote, all commodity exports to the EU were £132.9 billion, but by 2019 they had risen to £170.7 billion, a rise of 28.4 per cent.30 Meanwhile, non-EU all commodity exports rose slightly more by 31.3 per cent over the same period. However, if we exclude precious metal exports which predominately go to China, Hong Kong and Switzerland, the figures reverse, with exports up 28 per cent to EU countries but up only 24.3 per cent to non-EU countries, as shown in table 5. If Brexit had any influence on UK trade after the referendum vote, it appears to have increased exports to the EU. Although imports grew more from non-EU countries, this trend has been ongoing for many years as non-EU producers become more competitive (Asia) or more technically dominant (the US) or as the UK economy becomes more reliant on imported gas from Norway, the US and Qatar.

It might be suspected that this growth in trade was influenced by inflation, but the ONS’s Chained Volume Measures (CVM) shows exports to EU and non-EU destinations increased by exactly the same amount. Imports from the EU increased by more than imports from non-EU countries in the run-up to Brexit.

The Financial Times recently claimed that the UK was at the bottom of the G7 countries when it came to goods exports and attempted to blame this on Brexit in an article entitled ‘UK’s goods exports lowest in G7 following Brexit, study finds’.31 But this was simply bad economics. The UK’s goods exports values are back to pre-Brexit and pre-Covid levels but have been steady in US dollar terms since 2006 as more UK companies have moved their manufacturing offshore and the UK economy has become more service-oriented. Although the UK is one of the lowest goods exporters in the G7, it is also the second largest service exporter in the G7. So, for total trade the UK is firmly in the middle of the G7.

Graph 1 of G7 country goods exports measured in US dollars shows that the UK’s goods exports are at a similar level to those of Canada, France and Italy, while Japan, Germany and the US remain large goods exporters.32 Before 2020 Canada had the lowest exports in the G7 most of the time but moved above the UK in 2022 due to the surge in oil and gas, fertiliser, mining and agricultural commodity prices, not Brexit. These made up about half of Canadian exports in 2022.33 Canadian exports of Mineral Fuels (HS 27), alone were up by C$142 billion (£93 billion) between 2020 and 2022.34
According to the ONS and OECD,35 only 51.6 per cent of the UK’s total exports in 2021 were goods, while over 70 per cent of total US and French exports and over 80 per cent of total Canadian, German, Italian and Japanese exports were goods. For the UK to still export goods of similar value to other G7 nations is notable considering goods make up a much smaller proportion of the UK’s total exports. If the UK Government wanted to increase the country’s goods exports, then it could revisit its taxation and regulations concerning oil and gas production and mimic the US and Canada’s rapid increase in goods exports since 2020.
It has also been claimed by some economists that the UK’s trade intensity is too low, and that this is both a bad thing and due to Brexit. But trade intensity only measures the relative value of a country’s total trade to its GDP, it is not a measure of economic prosperity. The trade intensity of the G7 countries in 2022 was 25 per cent for the US, 37 per cent for Japan, 67 per cent for Canada, 69 per cent for the UK, 72 per cent for France, 76 per cent for Italy and 99 per cent for Germany.36 The UK’s trade intensity is neither too low nor unusual in the G7.
Countries with high trade intensity are more susceptible to external shocks. Some economists criticised the fall in the UK’s trade intensity during Covid, which they mistakenly blamed on Brexit without looking first at the type of goods the UK trades, how UK trade was disproportionately susceptible to travel bans, and component shortages in comparison to other G7 countries with more varied export industries. They also appear to have used total UK trade to calculate trade intensity even though only the UK’s trade with the EU would have been affected by Brexit.
The OBR’s chairman, Richard Hughes, claimed in October 2021 that the impact of Brexit ‘would reduce our long run GDP [gross domestic product] by around 4%’.37 This appears to have been his opinion rather than an official OBR projection since OBR reports usually refer to relative productivity rather than absolute GDP. Yet it has been repeated in the media as apparently authoritative,38 and exaggerated by anti-Brexit politician Tobias Ellwood MP as an annual reduction, rather than over the long term. Ellwood claimed on the Peston television programme that Brexit was ‘costing our nation 4% of GDP a year’.39
The OBR’s original estimate of the long-run effect on UK productivity of trading with the EU on FTA terms came from the average of thirteen estimates gathered from various NGOs, central banks, economists and think tanks using different econometric models. The results were published in March 202040 but three of the estimates date from 2016: one from the OECD and two produced by the Netherlands Centraal Planbureau (CPB)41 using different econometric models, while the lowest estimate, a drop of 10 per cent, came from the World Bank and was dated 2017. In 2016, 2017 and even 2018 the exact legal basis of the UK’s future trading relationship with the EU was unknown. Even the three 2019 estimates of −2.5 per cent, −3.5 per cent and −6.4 per cent were made at least a year before the TCA was signed in December 2020.
It is also interesting that the OBR’s March 2020 publication stated that it assumed it would take 15 years for the impact of Brexit to come through, but it did not specifically mention, as it did in later publications, that its estimate of the effect on the UK’s productivity is relative to remaining in the EU.
In the most recent Brexit analysis by the OBR, dated 17 April 2023, its assumptions state that Brexit ‘will reduce long-run productivity by 4% relative to remaining in the EU’.42 And although ‘will’ sounds very definite, a relative reduction is not an absolute reduction and there is also no counterfactual for comparison. So, UK productivity could increase over the long term but still be claimed by the OBR to be lower than it would have been had the UK remained in the EU. More importantly, a reduction in relative long-run productivity is not the same as an absolute reduction in GDP.
The analysis leading the OBR to its conclusion arises from its view about the effect of Brexit on trade. In 2023, it said,
But the external studies the OBR references were all written in 2016 before the referendum and mostly by organisations who were publicly hostile to Brexit. A ‘typical’ EU trade agreement does not grant immediate tariff-free and quota-free market access for all goods, but retains quotas on goods and reduces tariffs gradually over many years. But in the case of the TCA, the UK and EU granted each other immediate and completely tariff-free and quota-free goods access. This should have invalidated all of the external estimates used by the OBR, yet the 4 per cent figure has remained fixed in the public imagination.
Additionally, the OBR’s external studies would have had no way of assessing – in 2016 – how the TCA’s Rules of Origin would affect UK EU trade. That was four years before the trade agreement was written. But even when the terms of the TCA were known, the OBR in its March 2022 publication,44 entitled ‘The evidence on the impact of Brexit on UK trade’, explained the drop in EU imports and increase in non-EU imports as being caused by substitution rather than due to the Rules of Origin in the TCA.
Another argument made by the OBR is that Brexit will lead to a major drop in trade where:
As the UK and EU have tariff-free and quota-free trade, only non-tariff barriers could reduce UK trade with the EU. But to cause such a large disruption to trade, the OBR’s ‘external studies’ must have assumed that most UK exporters were unfamiliar with trade compliance processes or that waiting times at ports would increase by so much that exporters and importers would cease to trade.
However, the UK’s largest exporting companies export goods all over the world and deal with trade compliance and logistics issues on a daily basis. Waiting times at ports should decrease with HMRC’s digital customs platform46 launched in April 2023, which is helping SMEs make import and export declarations. The UK’s Electronic Trade Documents Act47 comes into force in September 2023 and should also remove compliance barriers for SMEs. In addition, the Channel Tunnel, responsible for about 25 per cent of UK–EU trade, announced in July 2023 that its ‘Border Pass’ technology allows hauliers to clear customs and cross the channel at the same speed as before Brexit.48
For total UK trade, exports and imports of goods and services, to fall by 15 per cent due to Brexit, when trade with the EU makes up only 42 per cent of total UK trade,49 would require a massive drop of almost 36 per cent in UK trade with the EU. However, over the long run, the EU’s proportion of UK trade is likely to continue to fall simply because the rest of the world is growing faster than the EU and so offers the UK more trading opportunities.
The OBR also argued that the uncertainty around Brexit, and fear of Brexit trade impacts, would discourage investment in the UK which would contribute to its projected 4 per cent reduction in long-run productivity relative to remaining in the EU. The OBR estimated that:
However, as we show in point 3 of this paper, trade actually increased between the referendum and the signing of the UK–EU TCA. So the OBR’s assumption that trade will fall due to lower investment was already falsified by 2019 (see table 6). We have not seen a reduction in trade between the UK and the EU other than in goods that do not meet the TCA Rules of Origin requirements.
The fact that investment was lower during this period, but UK–EU trade did not decline, is explained by the fact that exports are driven by foreign demand for UK goods and services. Investment in the UK economy may improve the UK’s ability to produce those goods and services more efficiently, but it will not create a foreign demand that does not exist. Additionally, as Brexit uncertainty diminishes, any investment which was postponed should return, and this would further undermine the OBR’s projection of 4 per cent lower relative long-run productivity.
The OBR’s April 2023 Brexit analysis still references an OBR economic and fiscal outlook publication from November 2016 – well before the Brexit negotiations had started – to explain its 15 per cent lower trade estimate. In this 2016 document the OBR stated that:
One would have expected the OBR to recognise that its old analysis is no longer applicable. But when the trade data so clearly contradicts its conclusions, a revision is clearly mandatory. With this, the press may start to correct the false narrative that Brexit has been a disaster for the UK economy.
Any trade impact over time will include the impact of new trade deals, comparative economic growth in the UK’s trading partners as well as any economic benefits or restrictions from domestic regulatory changes. While the data is still emerging and longer-term effects are as-yet unknowable, in general, there has been no real disparity between UK trade with EU and non-EU countries. Nor has there been a sharp fall in UK–EU trade either at the aggregate or sector level despite it now being seven years since the vote to leave the EU and three years since the UK actually left. Regardless of the final effect of Brexit, it is hard to see any basis for continued acceptance of the OBR’s projection of a 4 per cent drop in relative long-run productivity given the emerging data.
However, even if Brexit has not negatively impacted UK trade, this does not mean that UK policy makers should become complacent about trade. Governments can also reduce trade with domestic regulations and uncompetitive taxes that cause companies to move their production to lower-cost, or more rationally taxed, jurisdictions. The challenges to the UK’s trade position are numerous and severe. For example:
In tackling these and other challenges, it is essential that we are realistic about them, and about their importance relative to such matters as Brexit. To have official sources continue to say that Brexit is much more damaging than the evidence suggests can only distract policy from the important issues it faces. For the UK to remain one of the world’s great trading nations, it must sell products that other nations want to buy and encourage companies to continue to base their operations in the UK by creating an encouraging regulatory and taxation environment.
Catherine McBride is an economist and member of the UK’s Trade and Agriculture Commission, an independent body responsible for scrutinizing the UK’s new trade agreements. Previously Catherine worked for the Institute of Economic Affairs, writing about financial service regulation after a career working in the equity and commodity derivative markets in London. She is a fellow of the Centre for Brexit Policy and writes regularly about trade and economics for the websites Briefings for Britain and GlobalBritain.
Fullscreen Mode
Contents
Summary
- Contrary to initial concerns, Brexit has not had a major detrimental
effect on UK–EU trade. - Trade data doesn’t support the Office for Budget Responsibility’s claims
that Brexit has caused significant negative impacts on the UK economy. - Data from 2019 to 2022 indicates that the trade in both goods and
services between the UK and EU hasn’t shown a discernible Brexit
effect. - Although Brexit has resulted in new compliance costs for trading with
the EU, the UK’s new digital customs platform should reduce these
costs, especially for SMEs unfamiliar with compliance procedures. Prior
to Brexit these costs were borne by the whole population in the form
of the UK’s EU membership payments rather than by the individual
importers or exporters who benefited directly. - While some sectors such as clothing and footwear showed a statistical
change this is due to the TCA Rules of Origin, and reflects the actual
manufacturing locations of both UK and EU products, not Brexit. - With the post-Covid rebound and new Free Trade Agreements, Brexit
has the potential to enhance, not hinder, the UK’s trade in future. - If the government wants to encourage trade it should focus on removing domestic regulation and taxes which make the UK uncompetitive.
This document has been updated since the print edition to reflect the government’s announcement that the ban on new petrol and diesel vehicles will be delayed until 2035.
This briefing note examines UK post-Brexit trade. Contrary to some media reports and many pre-Brexit assumptions, the data so far shows Brexit has not had a major impact on UK–EU trade. UK trade with EU countries has broadly moved in line with UK trade with non-EU countries, which should not have been the case if trade friction caused by Brexit had had a major impact on UK–EU trade. This is especially true when comparing EU and non-EU exports by industry sector, which my note Brexit and UK Trade – What Has Changed?1 discusses in detail.
Now that the worst Covid-related factory closures, component shortages and travel restrictions are over, it is possible to test the key assertion of those who argued that Brexit would damage the UK’s economy by examining whether UK–EU trade has decreased. If the Office for Budget Responsibility (OBR) is correct and the ‘exploitation of comparative advantage in trade has been significantly damaged’ by Brexit,2 then UK trade with the EU should be falling substantially compared to UK trade with other countries.
This paper does not claim there has been no impact on UK trade from Brexit. Although the UK and the EU have signed the Trade and Cooperation Agreement (TCA) granting each other tariff-free and quota-free trade, there will still be compliance costs of calculating Rules of Origin values, obeying Sanitary and Phytosanitary (SPS) regulations, and possible customs inspections. Whether these costs are prohibitive to trade will depend on the size of the exporting company, the proportion of goods they export to EU countries, and whether they exported to countries outside of the EU before Brexit, and so are familiar with the required processes and can easily absorb any additional costs.
While the UK was a member of the EU, taxpayers were paying for that membership. Among the beneficiaries were firms trading with the EU. These companies now have to pay for their own compliance when they trade with the EU as all companies do when they trade with non-EU countries. These costs will be either passed on to their customers as higher prices or absorbed as a business expense, but these costs will no longer be paid by all taxpayers.
As these additional costs are most likely to fall on small and medium sized enterprises (SMEs) unfamiliar with trade compliance, the Government set up an SME Brexit Support Fund in 20213 to teach SMEs how to comply with Customs, Rules of Origin and VAT processes. It is hoped that once SMEs have learnt to comply with EU customs processes, they will also have gained skills that will help them export to non-EU markets as well. However, from the UK–EU trade data so far, it is apparent that between 2019, the last full year of trade data before Brexit, and 2022, the most recent full year trade statistics:
1. Goods trade between the UK and EU does not show a Brexit effect.
If Brexit were a major disrupter of UK trade, we could expect to see a divergence between UK trade with EU destinations and UK trade with non-EU destinations. This is not the case. Office for National Statistics (ONS) trade data shows that trade flows by industry sector to EU and non-EU countries generally moved together. UK goods exports to EU countries increased by 13.5 per cent and to non-EU countries by 14.3 per cent between 2019 and 2022 (all commodities, current prices – see table 1).
If we exclude precious metals, then exports to EU destinations increased by 13.4 per cent while exports to non-EU countries increased by only 5.7 per cent (see table 2), and if we use deflated data then exports to EU countries fell by 7.2 per cent but decreased by 9.8 per cent to non-EU countries (see table 3).4
2. Services trade between the UK and EU does not show a Brexit effect.
Service exports to the EU increased by 14.8 per cent from 2019 to 2022, and although total service trade with non-EU countries grew by more, there was wide variation between service industries (see table 4).5 Business services, telecommunications and intellectual property services all increased more to EU than to non-EU countries, while financial services, insurance and pensions, transport and travel services all increased more to non-EU countries. As exports are demand driven this is unlikely to be due to Brexit but simply due to varying rates of growth and requirements for different types of services in different export destinations.
3. The Brexit referendum vote did not disrupt EU/UK trade.
It has been suggested by the OBR that two fifths of the impact from Brexit on UK relative productivity occurred between the Brexit referendum in 2016 and the signing of the UK–EU TCA in December 2020, caused by lower investment which in turn caused lower trade. This is not apparent in the trade data: UK–EU trade continued to grow from 2015, before the Brexit referendum, until 2019, the last full year before the UK left the EU (see table 5).
4. Trade comparisons with other nations have not fundamentally changed.
While it has been claimed that the UK was at the bottom of the G7 for goods exports, this merely echoes the UK economy’s long-term trade patterns as it moved away from manufacturing to become a major service provider.6 Considering data from the past twenty years, the UK was generally the second smallest goods exporter in the G7 until 2021 when Canada’s commodity-based economy saw a boost from oil and gas exports that pushed it ahead of the UK (see graph 1). The UK’s general trade pattern has not fundamentally shifted since Brexit in comparison to other G7 countries; the UK is still the second largest service exporter in the G7 after the US.7
5. The OBR’s claim that Brexit will negatively impact the UK economy is not supported by trade data. The OBR’s chairman stated in October 2021 that leaving the EU would ‘reduce [the UK’s] long run GDP by around 4%’.8 The OBR’s April 2023 Brexit analysis claims that Brexit will reduce long-run productivity by 4 per cent relative to remaining in the EU and assumes that post-Brexit trade friction would cause both exports and imports to be 15 per cent lower in the long run than if the UK had remained in the EU.9 Neither claim is supported by the trade data so far. The UK and EU have a tariff-free and quota-free trade deal and the UK’s major exports have been unperturbed by trade friction between the UK and the EU.
The OBR also claimed that lower trade would be caused by lower investment in the UK due to Brexit uncertainty.10 However, if so, this also is not apparent in the trade data, and now that Brexit uncertainty has been removed, postponed investment in the UK economy is likely to be reinstated.
Taken together, the data indicates that Brexit has not negatively impacted UK–EU trade. The argument that Brexit might have some impact on the future level of UK–EU trade cannot be completely disproven, but any impact is extremely unlikely to be sufficient to see trade 15 per cent lower or productivity 4 per cent lower than if the UK had remained in the EU, as the OBR claimed it would. Indeed, more widely, given the rebound in post-Covid trade; the recent Free Trade Agreements (FTAs) with Australia, New Zealand and the Comprehensive and Progressive Agreement for Trans-Pacific Partnership (CPTPP); the ongoing trade negotiations with India and the Gulf Cooperation Council; and renegotiations of trade agreements with Canada, Mexico, South Korea, Switzerland and Turkey, as well as potential regulatory freedom which could improve UK competitiveness, Brexit overall should boost UK trade.
Further details on these points are given below:
Goods trade between the UK and EU does not show a Brexit effect
Table 1 shows how goods trade has changed pre and post Brexit, between 2019 and 2022.11

Both EU and non-EU countries saw a large drop in trade in 2020 and 2021 due to Covid lockdowns, factory closures, key component shortages and international travel restrictions. UK trade with both EU and non-EU countries rebounded in 2022. From 2019 to 2022, goods exports to EU and non-EU destinations both grew by roughly 14 per cent for all commodities making a Brexit effect impossible to discern. The most substantial difference between UK trade with EU and non-EU countries was soaring fuel prices, which increased UK non-EU fuel imports by £55.5 billion between 2021 and 2022 as well as adding £19.9 billion to UK EU fuel exports.12
If we exclude precious metals from the trade figures, as is customary, goods exports to EU destinations have outperformed exports to non-EU destinations substantially, an increase of 13 per cent to the EU but only an increase of 6 per cent to non-EU countries. This makes any claims that Brexit has harmed UK trade with the EU look absurd.13
In addition, using the ONS’s Chained Volume Measures (CVM) to account for inflation, UK goods exports, excluding precious metals, fell by 7.2 per cent to EU countries between 2019 and 2022 but decreased by 9.8 per cent to non-EU countries (see table 3).14 This again makes it difficult to claim Brexit has hurt UK–EU trade.
Whether we look at all commodities or all commodities excluding precious metals, whether measured in current prices or by CVM, goods exports to the EU have performed as well or better than exports to non-EU countries since Brexit. In all measurements there has been an obvious shift in imports from non-EU countries, although this is in part due to increased gas imports from the three non-EU countries Norway, the US and Qatar.
If we delve deeper into individual export sectors, in most cases, UK exports to both EU and non-EU countries followed similar patterns, so any decline in exports in 2020/21 cannot be blamed on Brexit but was presumably due to other factors. These include Covid factory closures, key component shortages and lower international demand, or long-term reductions in UK production due to domestic regulations, higher costs or higher taxation.
The trade data also shows a greater diversity in trade with individual EU countries with UK exports increasing to some EU countries while decreasing to others. If Brexit trade friction were the cause of lower exports to the EU, it should have lowered trade to all EU destinations not just to some of them.
In the handful of cases where there were differences in EU and non-EU exports patterns this related to specific issues – most notably:
- The TCA Rules of Origin reduced UK–EU trade in goods predominantly manufactured outside the UK or the EU. This was most obvious for exports and imports of clothing, textiles and footwear and some tropical fruit exports. UK exports of clothing have halved from over £5 billion to just over £2 billion post-Brexit. However, these goods have been made outside the UK since the 1990s and under the TCA Rules of Origin will now be recorded as exports from the country of their manufacture.15 This also hit UK clothing imports from the EU. For example, between 2019 and 2022, UK imports of clothing rose by 44 per cent from Myanmar, 33 per cent from Pakistan and 20 per cent from Morocco, while clothing imports fell from Romania by 54 per cent, the Netherlands by 34 per cent, Italy by 12 per cent and Belgium by 11 per cent. Again, this was not caused by a massive and sudden change in consumer demand, but by changes in the Rules of Origin.16 Similarly, tropical and citrus fruit have never been grown in the UK commercially, so any pre-Brexit reported exports were only ever re-exports to the EU of fruit imported from Africa or the Caribbean. This is therefore why UK fruit and nut export statistics fell from £280 million in 2020, the end of the transition period, to £117 million in 2022 due to the TCA Rules of Origin.17
- Key component shortages such as computer chips used in UK and EU car manufacture reduced domestic car production and consequently exports to all destinations. The component shortage continued in 2022 but appears to have been resolved by the middle of 2023. Exports of Motor Vehicles (SIC 29.1) to non-EU countries in Q2 2023 were 5.6 per cent above their Q4 2019 values, while exports to EU countries in Q2 2023 were 8.0 per cent above Q4 2019 values.18
- Travel restrictions during Covid reduced airline profits and consequently demand for new aircraft. This also lowered demand for UK exports of jet engines, aircraft wings and aircraft seats to all destinations but particularly to Airbus assembly factories in France and Germany. Exports of aerospace goods revived in the second half of 2022 and exports to non-EU countries in the second quarter of 2023 were £6.4 billion, well above their previous record levels of £6.0 billion recorded in Q4 2018. Exports to EU countries of £3.7 billion in Q2 2023 were 17 per cent higher than their record pre-Brexit high of £3.2 billion in Q1 2019.19 This is due to Air India’s new order for 40 Airbus A350s that are powered by Rolls-Royce Trent XWB engines and assembled in the EU.20
There are other issues that have changed UK trade statistics that have nothing to do with Brexit, most notably UK companies moving their factories to eastern EU countries or to Asian countries. For example, the British carmaker Jaguar Land Rover agreed to move its production of the new Land Rover Defender to Slovakia in December 201521 well before the Brexit referendum. The new factory opened in November 2018, 22 and this has turned many UK car exports to the EU into UK car imports from the EU. UK companies off-shoring their manufacturing started well before Brexit; the Financial Times was investigating factory relocations as long ago as 2010.23
Additionally, all petroleum product production has been falling in the UK since 2003, with oil and gas production in 2021 the lowest in 50 years,24 resulting in lower exports. Without looking at longer-term data, the fall in these exports since 2016 could be mistakenly blamed on Brexit although the decline started well before the Brexit referendum.
Brexit has also changed country level trade data because of changes in distribution management. For example, Belgium has become an EU distribution hub for UK pharmaceuticals. Its medicinal and pharmaceutical imports from the UK increased by 280 per cent between 2019 and 2022 making it the UK’s second largest EU market after Germany.25 But this has also caused exports to other EU markets to fall. For example, UK medicinal and pharmaceutical exports to Spain fell by 49 per cent and to Sweden by 44 per cent between 2019 and 2022.26
For these reasons, individual sector data should be analysed carefully and with full context, to determine whether Brexit has had any meaningful impact on UK trade.
Individual firms might be complaining about customs declarations or distribution issues – and these claims may be anecdotally valid. However, they do not reflect the bulk of UK trade and should not be thought of as showing wider trade patterns. Similarly, individual importers and exporters may face increased compliance costs but even trade with the EU was never entirely free. The costs were merely borne by the whole population in the form of the UK’s EU membership payments rather than by the individual importers or exporters who benefited directly from this subsidy.
Services trade between the UK and EU shows no Brexit impact
Brexit does not appear to have had much effect on UK trade in services either. The ONS data indicates that between 2019 and 2022 exports in services rose faster than exports of goods to both the EU and to non-EU countries (although imports were the other way around). Trade in services thus far shows no significant Brexit effect.
Although service trade with the EU has not performed as well as service trade with the rest of the world, this varies greatly by the type of service and in most service sectors trade with the EU continued to grow between 2019 and 2022. 27
Seven service sectors made up 95 per cent of UK service exports in 2022. The UK’s largest service sector, Other Business Services, accounts for almost 40 per cent of UK total service exports, and business service exports to EU countries increased by 30 per cent between 2019 and 2022 while exports to non-EU countries rose by 26 per cent. Intellectual Property Service exports to EU countries were up by almost 50 per cent while they fell by 7 per cent to non-EU countries. And exports of Telecommunications, Computer and Information Services to EU countries were up by 38 per cent while exports to non-EU countries rose by only 31 per cent. Inversely, Insurance and Pension exports increased by 58 per cent to non-EU countries but by 45 per cent to EU countries. Travel exports between 2019 and 2022 increased by 26 per cent to non-EU countries but were up by only 11 per cent to EU countries, having dropped by 62 per cent in 2020 due to Covid travel restrictions. 28
The only exceptions were Financial Service exports that make up about 18 per cent of total service exports and were 4.5 per cent lower to the EU in 2022 than in 2019. However, this does not appear to be Brexit related, just normal market variations as EU exports were up 1.5 per cent in 2020 compared to 2019. Financial Service exports to the EU have been relatively flat for some years, increasing only 8 per cent between 2016 and 2022, while exports to non-EU countries increased by 33 per cent and are now worth twice as much as financial service exports to the EU.29
The other large service sector where exports to the EU are still below their 2019 levels was Transportation, which made up 7 per cent of the UK’s total service exports in 2022. Exports to the EU were 21 per cent below their 2019 level in 2022 although this is an improvement from their 49 per cent fall between 2019 and 2021 due to Covid. Transportation to non-EU countries has fully recovered since Covid and in 2022 was slightly above its 2019 value.
The remaining 5 per cent of total UK service exports, spread over five service sectors, have had varying results. Exports of some sectors have increased enormously to the EU since 2019, such as manufacturing services up 80%, while others such as Government Services exports to the EU were down 40 per cent and Personal, Cultural & Recreational Services exports to the EU were virtually unchanged. But these services are only worth a small absolute amount of total UK service trade and these large gyrations reflect the nature of these businesses rather than any Brexit-related trend.
After the Brexit referendum in 2016 goods exports increased more to the EU than non-EU
Reviewing the trade data, it is hard to substantiate claims about a major negative Brexit effect on UK trade. Britain’s leaving of the European Union is not sufficient to overshadow the wider operation of trade. Trade flows largely relate to domestic industry structure, wider international and domestic economic factors, and technological or other exogenous factors. Exports are always demand driven. For example, it is likely that UK exports to Germany will be lower this year due to Germany’s recession, not Brexit.
A fair assessment of the impact of Brexit on trade should also consider trade flows in the immediate aftermath of the decision in 2016 to leave the EU. If Brexit did have a large negative impact on trade, this should have been evident in reduced trade volumes before 2019 in anticipation of a forthcoming breakup, as companies should have been preparing to reorientate their operations. In reality, the opposite happened. In 2015, before the Brexit vote, all commodity exports to the EU were £132.9 billion, but by 2019 they had risen to £170.7 billion, a rise of 28.4 per cent.30 Meanwhile, non-EU all commodity exports rose slightly more by 31.3 per cent over the same period. However, if we exclude precious metal exports which predominately go to China, Hong Kong and Switzerland, the figures reverse, with exports up 28 per cent to EU countries but up only 24.3 per cent to non-EU countries, as shown in table 5. If Brexit had any influence on UK trade after the referendum vote, it appears to have increased exports to the EU. Although imports grew more from non-EU countries, this trend has been ongoing for many years as non-EU producers become more competitive (Asia) or more technically dominant (the US) or as the UK economy becomes more reliant on imported gas from Norway, the US and Qatar.
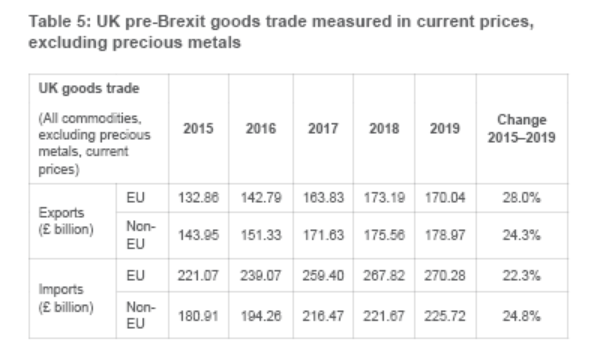
It might be suspected that this growth in trade was influenced by inflation, but the ONS’s Chained Volume Measures (CVM) shows exports to EU and non-EU destinations increased by exactly the same amount. Imports from the EU increased by more than imports from non-EU countries in the run-up to Brexit.
The UK’s trade position relative to others has not changed
The Financial Times recently claimed that the UK was at the bottom of the G7 countries when it came to goods exports and attempted to blame this on Brexit in an article entitled ‘UK’s goods exports lowest in G7 following Brexit, study finds’.31 But this was simply bad economics. The UK’s goods exports values are back to pre-Brexit and pre-Covid levels but have been steady in US dollar terms since 2006 as more UK companies have moved their manufacturing offshore and the UK economy has become more service-oriented. Although the UK is one of the lowest goods exporters in the G7, it is also the second largest service exporter in the G7. So, for total trade the UK is firmly in the middle of the G7.
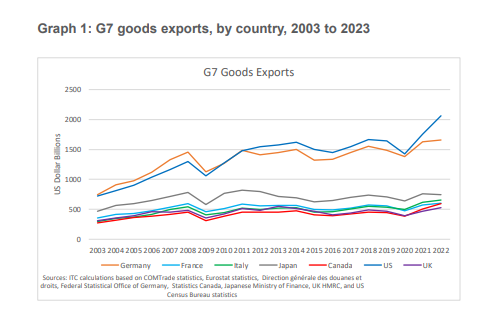
Graph 1 of G7 country goods exports measured in US dollars shows that the UK’s goods exports are at a similar level to those of Canada, France and Italy, while Japan, Germany and the US remain large goods exporters.32 Before 2020 Canada had the lowest exports in the G7 most of the time but moved above the UK in 2022 due to the surge in oil and gas, fertiliser, mining and agricultural commodity prices, not Brexit. These made up about half of Canadian exports in 2022.33 Canadian exports of Mineral Fuels (HS 27), alone were up by C$142 billion (£93 billion) between 2020 and 2022.34
According to the ONS and OECD,35 only 51.6 per cent of the UK’s total exports in 2021 were goods, while over 70 per cent of total US and French exports and over 80 per cent of total Canadian, German, Italian and Japanese exports were goods. For the UK to still export goods of similar value to other G7 nations is notable considering goods make up a much smaller proportion of the UK’s total exports. If the UK Government wanted to increase the country’s goods exports, then it could revisit its taxation and regulations concerning oil and gas production and mimic the US and Canada’s rapid increase in goods exports since 2020.
It has also been claimed by some economists that the UK’s trade intensity is too low, and that this is both a bad thing and due to Brexit. But trade intensity only measures the relative value of a country’s total trade to its GDP, it is not a measure of economic prosperity. The trade intensity of the G7 countries in 2022 was 25 per cent for the US, 37 per cent for Japan, 67 per cent for Canada, 69 per cent for the UK, 72 per cent for France, 76 per cent for Italy and 99 per cent for Germany.36 The UK’s trade intensity is neither too low nor unusual in the G7.
Countries with high trade intensity are more susceptible to external shocks. Some economists criticised the fall in the UK’s trade intensity during Covid, which they mistakenly blamed on Brexit without looking first at the type of goods the UK trades, how UK trade was disproportionately susceptible to travel bans, and component shortages in comparison to other G7 countries with more varied export industries. They also appear to have used total UK trade to calculate trade intensity even though only the UK’s trade with the EU would have been affected by Brexit.
The OBR’s analysis
The OBR’s chairman, Richard Hughes, claimed in October 2021 that the impact of Brexit ‘would reduce our long run GDP [gross domestic product] by around 4%’.37 This appears to have been his opinion rather than an official OBR projection since OBR reports usually refer to relative productivity rather than absolute GDP. Yet it has been repeated in the media as apparently authoritative,38 and exaggerated by anti-Brexit politician Tobias Ellwood MP as an annual reduction, rather than over the long term. Ellwood claimed on the Peston television programme that Brexit was ‘costing our nation 4% of GDP a year’.39
The OBR’s original estimate of the long-run effect on UK productivity of trading with the EU on FTA terms came from the average of thirteen estimates gathered from various NGOs, central banks, economists and think tanks using different econometric models. The results were published in March 202040 but three of the estimates date from 2016: one from the OECD and two produced by the Netherlands Centraal Planbureau (CPB)41 using different econometric models, while the lowest estimate, a drop of 10 per cent, came from the World Bank and was dated 2017. In 2016, 2017 and even 2018 the exact legal basis of the UK’s future trading relationship with the EU was unknown. Even the three 2019 estimates of −2.5 per cent, −3.5 per cent and −6.4 per cent were made at least a year before the TCA was signed in December 2020.
It is also interesting that the OBR’s March 2020 publication stated that it assumed it would take 15 years for the impact of Brexit to come through, but it did not specifically mention, as it did in later publications, that its estimate of the effect on the UK’s productivity is relative to remaining in the EU.
In the most recent Brexit analysis by the OBR, dated 17 April 2023, its assumptions state that Brexit ‘will reduce long-run productivity by 4% relative to remaining in the EU’.42 And although ‘will’ sounds very definite, a relative reduction is not an absolute reduction and there is also no counterfactual for comparison. So, UK productivity could increase over the long term but still be claimed by the OBR to be lower than it would have been had the UK remained in the EU. More importantly, a reduction in relative long-run productivity is not the same as an absolute reduction in GDP.
The analysis leading the OBR to its conclusion arises from its view about the effect of Brexit on trade. In 2023, it said,
‘the increase in non-tariff barriers on UK-EU trade acts as an additional impediment to the exploitation of comparative advantage. In order to generate this figure, we looked at a range of external estimates of the effect of leaving the EU under the “typical” free trade agreement (FTA).’43
But the external studies the OBR references were all written in 2016 before the referendum and mostly by organisations who were publicly hostile to Brexit. A ‘typical’ EU trade agreement does not grant immediate tariff-free and quota-free market access for all goods, but retains quotas on goods and reduces tariffs gradually over many years. But in the case of the TCA, the UK and EU granted each other immediate and completely tariff-free and quota-free goods access. This should have invalidated all of the external estimates used by the OBR, yet the 4 per cent figure has remained fixed in the public imagination.
Additionally, the OBR’s external studies would have had no way of assessing – in 2016 – how the TCA’s Rules of Origin would affect UK EU trade. That was four years before the trade agreement was written. But even when the terms of the TCA were known, the OBR in its March 2022 publication,44 entitled ‘The evidence on the impact of Brexit on UK trade’, explained the drop in EU imports and increase in non-EU imports as being caused by substitution rather than due to the Rules of Origin in the TCA.
Another argument made by the OBR is that Brexit will lead to a major drop in trade where:
‘both exports and imports will be around 15 per cent lower in the long run than if the UK had remained in the EU. The size of this adjustment is calibrated to match the average estimate of a number of external studies that considered the impact of leaving the EU on the volume of UK-EU trade.’45 (my emphasis)
As the UK and EU have tariff-free and quota-free trade, only non-tariff barriers could reduce UK trade with the EU. But to cause such a large disruption to trade, the OBR’s ‘external studies’ must have assumed that most UK exporters were unfamiliar with trade compliance processes or that waiting times at ports would increase by so much that exporters and importers would cease to trade.
However, the UK’s largest exporting companies export goods all over the world and deal with trade compliance and logistics issues on a daily basis. Waiting times at ports should decrease with HMRC’s digital customs platform46 launched in April 2023, which is helping SMEs make import and export declarations. The UK’s Electronic Trade Documents Act47 comes into force in September 2023 and should also remove compliance barriers for SMEs. In addition, the Channel Tunnel, responsible for about 25 per cent of UK–EU trade, announced in July 2023 that its ‘Border Pass’ technology allows hauliers to clear customs and cross the channel at the same speed as before Brexit.48
For total UK trade, exports and imports of goods and services, to fall by 15 per cent due to Brexit, when trade with the EU makes up only 42 per cent of total UK trade,49 would require a massive drop of almost 36 per cent in UK trade with the EU. However, over the long run, the EU’s proportion of UK trade is likely to continue to fall simply because the rest of the world is growing faster than the EU and so offers the UK more trading opportunities.
The OBR also argued that the uncertainty around Brexit, and fear of Brexit trade impacts, would discourage investment in the UK which would contribute to its projected 4 per cent reduction in long-run productivity relative to remaining in the EU. The OBR estimated that:
‘around two-fifths of the 4 per cent impact had already occurred by the time the TCA (Trade and Co-Operation Agreement) came into force, as a result of uncertainty weighing on investment and capital deepening’.50
However, as we show in point 3 of this paper, trade actually increased between the referendum and the signing of the UK–EU TCA. So the OBR’s assumption that trade will fall due to lower investment was already falsified by 2019 (see table 6). We have not seen a reduction in trade between the UK and the EU other than in goods that do not meet the TCA Rules of Origin requirements.
The fact that investment was lower during this period, but UK–EU trade did not decline, is explained by the fact that exports are driven by foreign demand for UK goods and services. Investment in the UK economy may improve the UK’s ability to produce those goods and services more efficiently, but it will not create a foreign demand that does not exist. Additionally, as Brexit uncertainty diminishes, any investment which was postponed should return, and this would further undermine the OBR’s projection of 4 per cent lower relative long-run productivity.
The OBR’s April 2023 Brexit analysis still references an OBR economic and fiscal outlook publication from November 2016 – well before the Brexit negotiations had started – to explain its 15 per cent lower trade estimate. In this 2016 document the OBR stated that:
‘we have not attempted to predict the precise end result of the negotiations. Instead, we have made a judgement – consistent with most external studies – that over the time horizon of our forecast any likely Brexit outcome would lead to lower trade flows, lower investment and lower net inward migration than we would otherwise have seen, and hence lower potential output.’51
One would have expected the OBR to recognise that its old analysis is no longer applicable. But when the trade data so clearly contradicts its conclusions, a revision is clearly mandatory. With this, the press may start to correct the false narrative that Brexit has been a disaster for the UK economy.
Conclusion, and a warning
Any trade impact over time will include the impact of new trade deals, comparative economic growth in the UK’s trading partners as well as any economic benefits or restrictions from domestic regulatory changes. While the data is still emerging and longer-term effects are as-yet unknowable, in general, there has been no real disparity between UK trade with EU and non-EU countries. Nor has there been a sharp fall in UK–EU trade either at the aggregate or sector level despite it now being seven years since the vote to leave the EU and three years since the UK actually left. Regardless of the final effect of Brexit, it is hard to see any basis for continued acceptance of the OBR’s projection of a 4 per cent drop in relative long-run productivity given the emerging data.
However, even if Brexit has not negatively impacted UK trade, this does not mean that UK policy makers should become complacent about trade. Governments can also reduce trade with domestic regulations and uncompetitive taxes that cause companies to move their production to lower-cost, or more rationally taxed, jurisdictions. The challenges to the UK’s trade position are numerous and severe. For example:
- Astra Zeneca has announced it will move production to Ireland due to UK corporate taxes.52 Even if a company remains based in the UK, if its production is outside the UK and it fulfils its exports from that production facility, then UK export statistics will be lower. If a company moves its headquarters out of the UK to escape high corporate taxes not only will the UK have lower export statistics it will also lose the tax revenue – a much greater problem.
- Similarly, the reduction in UK oil and gas production due to the Government’s net zero legislation and windfall taxes, both lowered UK oil and gas exports and increased the UK’s reliance on imported oil and gas. In 2003 the UK imported just over 2 million tonnes of gas and exported 15.9 million tonnes, twenty years later in 2022 it imported 44.8 million tonnes of gas53 and exported 9.4 million tonnes.54 Norway provided 55 per cent of the UK gas imports in 2022, with the US, Qatar and Peru providing the rest as Liquid Natural Gas – a more expensive and more emission-intensive production process.
- The case for using the UK’s own gas reserves is not an argument about the importance of environmental concerns, but rather one about the UK’s balance of payments. Imported fossil fuels are not less damaging to the environment than domestically produced ones. But imports of SITC 3 Fuels added £57.7 billion to the UK’s trade deficit in 2022, equal to two thirds of the UK’s total trade deficit of £86.6 billion.55 The UK relies on gas-fired power stations for back-up electricity every time the wind drops. During the twelve months to August 2023, fossil fuels accounted for 39.4 per cent of the UK’s electricity production as well as being an important input in many petrochemical-based industries, while wind and solar combined provided just 34.6 per cent.56 As the country converts to electric vehicles and electric heat pumps, the UK will need more back-up electricity, which means there will be a need for more gas.
- The UK has also legislated to stop the production of petrol- and diesel-fuelled cars by 2030 but many of the UK’s vehicle export customers do not have similar restrictions on purchasing petrol and diesel vehicles. EU countries bought 38 per cent of UK motor vehicle exports in 2022 but will be able to continue making and buying petrol and diesel cars until 2035. Many of the UK’s fast growing developing markets have not committed to net zero before 2050 and 2060. Thus, UK domestic legislation is presently set to undermine one of the UK’s major goods export industries regardless of Brexit. Successful exporters must be able to make products that their customers want to buy. If the Government continues with this legislation, including for vehicles for export, then it will force manufacturers to move their non-EV production out of the UK and again reduce UK exports. The government recently announced plans to align with the EU’s deadline, delaying the ban on new petrol and diesel cars until 2035. But UK car manufacturers should also be allowed to continue to manufacture petrol and diesel cars in the UK for their other export customers.
- Similarly, another of the UK’s largest export industries is aircraft parts, predominately jet engines, wings and seats for large passenger aircraft. If international net zero commitments make mass tourism and air travel unaffordable for the majority of the world’s populations, then these export industries will also disappear.
In tackling these and other challenges, it is essential that we are realistic about them, and about their importance relative to such matters as Brexit. To have official sources continue to say that Brexit is much more damaging than the evidence suggests can only distract policy from the important issues it faces. For the UK to remain one of the world’s great trading nations, it must sell products that other nations want to buy and encourage companies to continue to base their operations in the UK by creating an encouraging regulatory and taxation environment.
About the author
Catherine McBride is an economist and member of the UK’s Trade and Agriculture Commission, an independent body responsible for scrutinizing the UK’s new trade agreements. Previously Catherine worked for the Institute of Economic Affairs, writing about financial service regulation after a career working in the equity and commodity derivative markets in London. She is a fellow of the Centre for Brexit Policy and writes regularly about trade and economics for the websites Briefings for Britain and GlobalBritain.
PDF Viewer
Fullscreen Mode
Footnotes
- McBride, C. (2023) Brexit and UK Trade – What Has Changed?. London: Global Britain (https://tinyurl.com/4j6m68e9).
- ‘Brexit analysis’, Office for Budget Responsibility, March 2023
(https://tinyurl.com/2p898sah). - ‘£20 million SME Brexit Support Fund opens for applications’, Gov.UK,
15 March 2021 (https://tinyurl.com/y3jevefj). - ‘UK trade: goods and services publication tables’, Office for National Statistics, 11 August 2023 (https://tinyurl.com/kp3vxx3d).
- ‘UK trade in services: service type by partner country, Office for National Statistics,
27 July 2023. Spreadsheet 1: Time Series, filtered for Total EU27 and Rest of World. (link) - ‘UK’s goods exports lowest in G7 following Brexit, study finds’, Financial Times, 12 April 2023 (https://tinyurl.com/2p82p8rs).
- ‘What the FT didn’t tell you about UK exports and the G7’, Briefings for Britain, 17 April 2023 (https://tinyurl.com/5dbpwdfr).
- ‘Impact of Brexit on economy “worse than Covid”’, BBC News, 27 October 2021 (https://tinyurl.com/5fw7e5ve).
- ‘Economic and Fiscal Outlook’, Office for Budget Responsibility, March 2023, page 46, section 2.52 (link).
- Ibid.
- ‘UK trade: goods and services publication tables’, Office for National Statistics, 11 August 2023 (https://tinyurl.com/kp3vxx3d).
- ‘UK trade: goods and services publication tables’, Office for National Statistics, 11 August 2023, item SITC 3 Fuels (https://tinyurl.com/kp3vxx3d).
- Ibid.
- Ibid. Spreadsheet 8, Annual CVM
- ‘UK trade: goods and services publication tables’, Office for National Statistics,
11 August 2023 (https://tinyurl.com/kp3vxx3d). - Ibid.
- ITC TradeMap, 08 edible fruit and nuts, Exports, United Kingdom, values, GBP, (link)
- ‘Trade in goods: CPA (08) exports and imports’, Office for National Statistics, 11 August 2023 (https://tinyurl.com/bmrpvp5z). Spreadsheets: 5 EU exports annual, 9 non-EU exports annual, SIC 29.1 motor vehicles.
- Ibid. Item SIC 30.3 Air & spacecraft & related machinery.
- ‘Tata-owned Air India to acquire 250 Airbus aircraft’, Airbus, 14 February 2023 (https://tinyurl.com/b33kfd7n).
- ‘Jaguar Land Rovers confirms new factory in Slovakia’, JLR Newsroom,
11 December 2015 (https://tinyurl.com/4rkrppev). - ‘Jaguar Land Rover opens manufacturing plant in Slovakia’, JLR Newsroom, 25 October 2018 (https://tinyurl.com/25c35kw8).
- ‘Questions surround EU relocations’, Financial Times, 1 December 2010 (https://tinyurl.com/22t4x2xt).
- ‘Energy trends’, Department for Business, Energy & Industrial Strategy, 31 March 2022 (https://tinyurl.com/3sym9n8k).
- ‘Trade in goods: country-by-commodity exports’, Office for National Statistics, 11 August 2023 (https://tinyurl.com/yckyhc93).
- Ibid.
- UK trade in services: service type by partner country, Office for National Statistics, 27 July 2023 (link)
- ‘UK trade in services: Service type by partner country’, Office for National Statistics, 27 July 2023 (link)
- Ibid.
- ‘UK trade: goods and services publication tables, Office for National Statistics, 11 August 2023 (link).
- ‘UK’s goods exports lowest in G7 following Brexit, study finds’, Financial Times, 12 April 2023 (https://tinyurl.com/2p82p8rs).
- ITC TradeMap: TOTAL All products, exports, yearly time series, by countries, values, US Dollars’, (https://tinyurl.com/mvum5trd).
- ‘The International Trade Explorer, 2022’, Statistics Canada, 8 August 2023
(https://tinyurl.com/s6db2wvn). - ITC TradeMap: HS 27 Mineral Fuel exported by Canada, values, Canadian Dollars, (link)
- ‘Recent trends in the international trade flows of G7 economies’, Office for National Statistics, 20 October 2022. Table1: Exports and imports of goods as a percentage of total exports and imports, G7, 2019 to 2021 (https://tinyurl.com/3eak6myn).
- ‘Trade (% of GDP) – Germany, France, Italy, United Kingdom, United States, Japan, Canada’, The World Bank, 2023 (https://tinyurl.com/4d4rhebj).
- ‘Impact of Brexit on economy “worse than Covid”, BBC News, 27 October 2023 (https://tinyurl.com/5fw7e5ve).
- ‘UK economy 4% smaller because of Brexit, OBR’s Hughes says’, Bloomberg, 2023 (https://tinyurl.com/y4s7nfbz).
- Tory MP @Tobias_Ellwood: All politicians need to read the room’, Best for Britain,
3 May 2023 (https://tinyurl.com/amevzbxd). - ‘Economic and fiscal outlook’, Office for Budget Responsibility, March 2020, Box 2.1, Table A: Long-run effect on productivity of trading with EU on FTA terms, page 27, (link).
- The Netherlands Bureau for Economic Policy Analysis
- ‘Brexit analysis’, Office for Budget Responsibility, 17 April 2023, Current assumptions and judgements (https://tinyurl.com/2s3wy9m5).
- ‘Brexit analysis’, Office for Budget Responsibility, March 2023, Brexit analysis (https://tinyurl.com/2ptpn435).
- Ibid.
- Ibid. Current assumptions and judgements.
- ‘Customs Declaration Service’, Gov.UK, 23 August 2023 (https://tinyurl.com/2p9d6bat).
- ‘UK economy to receive £1 billion boost through innovative trade digitalisation act’, Gov.UK, 20 July 2023 (https://tinyurl.com/3yvrvjee).
- ‘Goods now crossing Channel at pre-Brexit speed, says tunnel chief’, The Times, 18 July 2023 (https://tinyurl.com/4aub3nf7).
- ‘Statistics on UK-EU trade’, House of Commons Library, 11 May 2023 (https://tinyurl.com/s6wmpe6e).
- ‘Brexit analysis’, Office for Budget Responsibility, March 2023
(https://tinyurl.com/2ptpn435). - ‘Economic and fiscal outlook’, Office for Budget Responsibility, Nov 2016, page 6, paragraph 1.5. (link)
- ‘AstraZeneca CEO says UK business climate deters investment’, Reuters, 9 February 2023 (https://tinyurl.com/yc46dy75).
- ITC TradeMap, HS 2711 gas imported by United Kingdom by tonne, (link)
- ITC TradeMap, HS 2711 gas exported by United Kingdom by tonne, (link)
- ‘UK trade: goods and services publication tables’, Office for National Statistics, 11 August 2023 (https://tinyurl.com/kp3vxx3d).
- ‘National Grid: Live’, National Grid, 2023 (https://tinyurl.com/54ub9ks3). Past year, Generation by source.
SHARE


