Is the special rapporteur right about poverty? (Part 1)
5 June 2019
SUGGESTED

Education
Education

Healthcare
4 July 2024
The United Nations special rapporteur on extreme poverty, Philip Alston, recently published his second and final report on poverty in the United Kingdom. He offers up a bleak picture, with rising levels of poverty, particularly among children, spelling out “a social calamity and an economic disaster rolled into one”. The social fabric is unravelling and we are becoming a colder, uncaring country with government austerity policy to blame. But is he right?
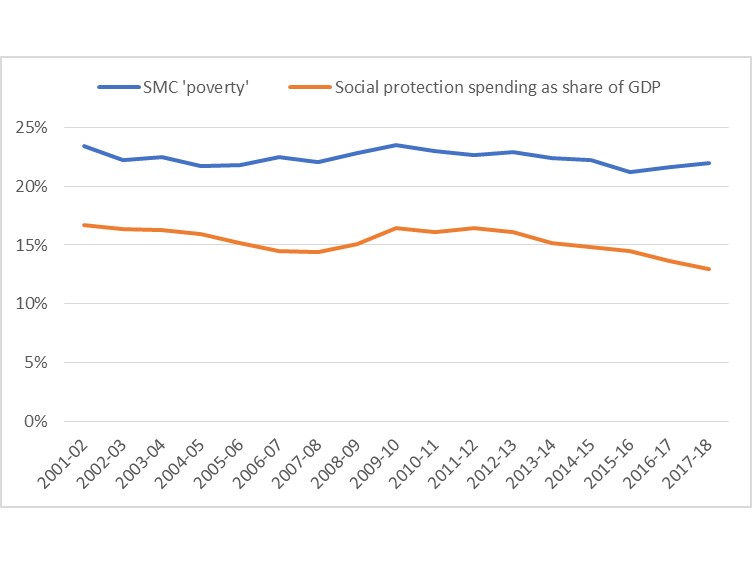
Alston claims that 22 per cent live in poverty based on a new measure constructed by the Social Metrics Commission. This is a relative measure of poverty but unlike the standard one, classifies all those with less than 55 per cent of median available resources as in poverty; it takes into account income but also other financial assets, as well as inescapable costs of living relating to things such as housing, childcare and disability.
I have critiqued this elsewhere, arguing that it is too high, does not correspond to other conceptually related measures, and fails to capture real increases in economic hardship. (Note that on this measure, a minority of those classified as in poverty are in families reporting material deprivation – 38.7 per cent.) But whatever is being measured, it shows no obvious bulge after 2009/10. Indeed, it seems to decline in proportion to the amount of government spending on social security from 2010 onwards (Figure 1).
Alston recommended that the government adopt this measure; something it has done. Yet he cannot endorse it and claim at the same time that austerity has increased poverty as it shows no concomitant rise – he cannot have it both ways.
Figure 1. Social metrics commission ‘poverty’ and government spending on social security

Consider his unwillingness to take on board the evidence on absolute poverty. Alston writes:
“First, it is true that so-called ‘absolute’ poverty has fallen, but this is a selective, widely criticized and mostly unhelpful indicator…Widely accepted independent measures find poverty is rising.”
Note the use of both “so-called” and quotation marks around the word “absolute” along with the double standards. By side-stepping this evidence, Alston is making a selection of his own. The absolute measure in question is the share with incomes 60 per cent below the median income of 2010/11. It is no more a “selective measure” than the ones Alston endorses, which are also criticised.
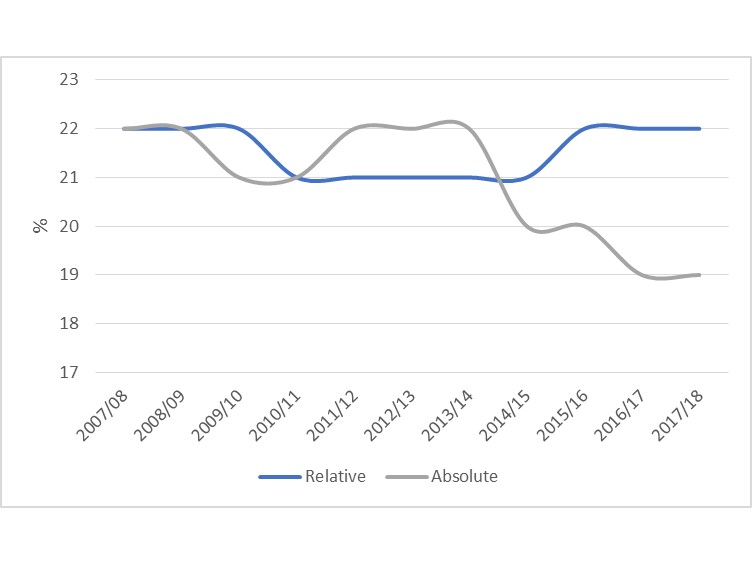
Relative poverty rates, defined as the share with household incomes less than 60 per cent of the contemporary median, are criticised for being unduly sensitive to movements in the median income. That is why “poverty” appears to decline during the last recession – as the median income goes down there are fewer people, by definition, with household incomes less than 60 per cent of the median (see Figure 2).
Perhaps the reason why Alston avoids talking about absolute poverty is because the evidence goes against him. Indeed, the most recent figure from official statistics of 19 per cent (after housing costs) is the lowest on record. (The latest figures showed a statistically insignificant increase on the year before on the before housing costs absolute measure, and no change after housing costs.)
This is meaningful evidence concerning living standards; the relative measure is much more one of income inequality.
Figure 2. Recent trends in absolute and relative poverty rates (after housing costs)
Alston claims that work increasingly does not pay:
“… nearly 60 per cent of those in poverty [are] in a family where someone works, and in-work poverty [is] on the rise.”
This figure stems from the Social Metrics Commission report. Alston arrives at a figure of 60 per cent by adding up all those families classified as in poverty where someone in the household is working. This means he is including families where just one person is working, possibly as little as part-time. What this means is his 60 per cent will be including households with people who are not working.
Moreover, this is what the Social Metrics Commission itself had to say about in-work poverty as measured by the metric of poverty that Alston endorses:
“Poverty rates for working-age adults in both workless and working families have remained relatively constant since 2001. However, because of a rising number of people in employment, the composition of working-age poverty has shifted towards those in working families.”
[My underlining for emphasis]
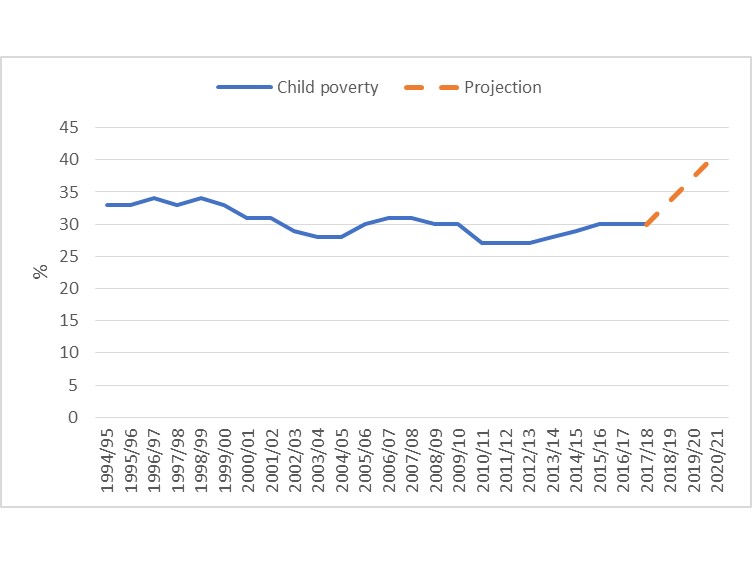
The most alarming claim is that the child poverty rate is set to rise between 2010 and 2021/22, with 1.5 million more children to fall into poverty and a child poverty rate rising to a “shocking 41 per cent”. The basis for this is an Equality and Human Rights Commission report by Jonathan Portes and Howard Reed.
This is based on economic forecasting of trends in relative child poverty after housing costs. What is the actual observed trend? For the past three years for which we have data, child poverty on this measure has remained constant at 30 per cent – Alston claims wrongly that it is “on the rise”. In fact, according to IFS figures, this measurement has never gone above 35 per cent, going back to the 1960s, throughout all economic upheavals.
Looking at the graph below, it is apparent the required 11 percentage point increase by 2021/22 is not going to happen, given current and long-term trends.
Figure 3. Relative child poverty after housing costs with necessary rise in order to meet EHRC projection
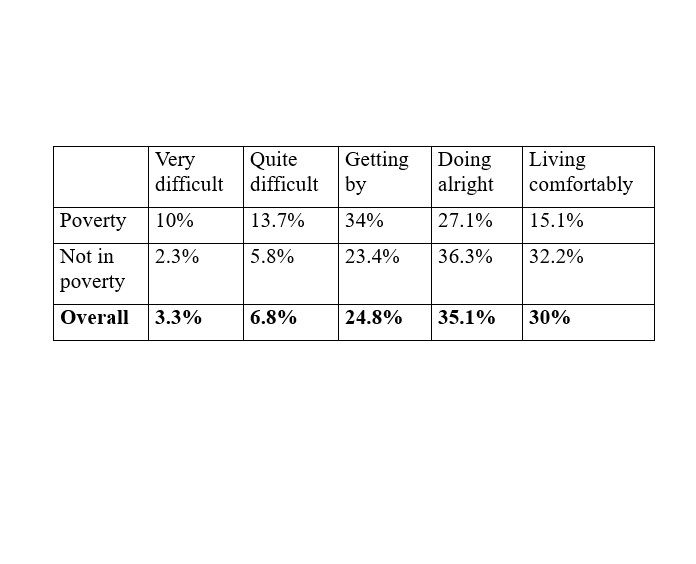
While the absolute measure is probably a more meaningful one in terms of measuring material progress, that is not to say either are correctly measuring poverty. My own analysis of Understanding Society data shows while 13 per cent are in relative poverty (before housing costs), the majority of these describe their financial situation as at least “getting by” if not better (see Table 1). Indeed, there were more people classified as in poverty, following standard conventions, describing their financial situation as “living comfortably” than “very difficult”.
Furthermore, 41 per cent of those classed as in poverty had access to satellite television at home, implying disposable income spent on non-essential items. This is inconsistent with most understandings of ‘poverty’.
Across the board, such poverty statistics are not particularly helpful because they capture people who want for very little. This is not to say everything is rosy – we have people in genuine need, with economic precariousness more widely spread. But all this needs to be measured accurately. (According to Eurostat, 4.6 per cent are severely deprived while 34 per cent cannot face unexpected financial expenses.)
And it is an open secret that conventional statistics are not even termed ‘poverty statistics’ in official documentation. They are named for what they are: measures of “relative/absolute low income”.
Table 1. Subjective financial situation by poverty status – Understanding Society Wave IV

Continued in Part 2
Alston claims that 22 per cent live in poverty based on a new measure constructed by the Social Metrics Commission. This is a relative measure of poverty but unlike the standard one, classifies all those with less than 55 per cent of median available resources as in poverty; it takes into account income but also other financial assets, as well as inescapable costs of living relating to things such as housing, childcare and disability.
I have critiqued this elsewhere, arguing that it is too high, does not correspond to other conceptually related measures, and fails to capture real increases in economic hardship. (Note that on this measure, a minority of those classified as in poverty are in families reporting material deprivation – 38.7 per cent.) But whatever is being measured, it shows no obvious bulge after 2009/10. Indeed, it seems to decline in proportion to the amount of government spending on social security from 2010 onwards (Figure 1).
Alston recommended that the government adopt this measure; something it has done. Yet he cannot endorse it and claim at the same time that austerity has increased poverty as it shows no concomitant rise – he cannot have it both ways.
Figure 1. Social metrics commission ‘poverty’ and government spending on social security
Consider his unwillingness to take on board the evidence on absolute poverty. Alston writes:
“First, it is true that so-called ‘absolute’ poverty has fallen, but this is a selective, widely criticized and mostly unhelpful indicator…Widely accepted independent measures find poverty is rising.”
Note the use of both “so-called” and quotation marks around the word “absolute” along with the double standards. By side-stepping this evidence, Alston is making a selection of his own. The absolute measure in question is the share with incomes 60 per cent below the median income of 2010/11. It is no more a “selective measure” than the ones Alston endorses, which are also criticised.
Relative poverty rates, defined as the share with household incomes less than 60 per cent of the contemporary median, are criticised for being unduly sensitive to movements in the median income. That is why “poverty” appears to decline during the last recession – as the median income goes down there are fewer people, by definition, with household incomes less than 60 per cent of the median (see Figure 2).
Perhaps the reason why Alston avoids talking about absolute poverty is because the evidence goes against him. Indeed, the most recent figure from official statistics of 19 per cent (after housing costs) is the lowest on record. (The latest figures showed a statistically insignificant increase on the year before on the before housing costs absolute measure, and no change after housing costs.)
This is meaningful evidence concerning living standards; the relative measure is much more one of income inequality.
Figure 2. Recent trends in absolute and relative poverty rates (after housing costs)
Alston claims that work increasingly does not pay:
“… nearly 60 per cent of those in poverty [are] in a family where someone works, and in-work poverty [is] on the rise.”
This figure stems from the Social Metrics Commission report. Alston arrives at a figure of 60 per cent by adding up all those families classified as in poverty where someone in the household is working. This means he is including families where just one person is working, possibly as little as part-time. What this means is his 60 per cent will be including households with people who are not working.
Moreover, this is what the Social Metrics Commission itself had to say about in-work poverty as measured by the metric of poverty that Alston endorses:
“Poverty rates for working-age adults in both workless and working families have remained relatively constant since 2001. However, because of a rising number of people in employment, the composition of working-age poverty has shifted towards those in working families.”
[My underlining for emphasis]
The most alarming claim is that the child poverty rate is set to rise between 2010 and 2021/22, with 1.5 million more children to fall into poverty and a child poverty rate rising to a “shocking 41 per cent”. The basis for this is an Equality and Human Rights Commission report by Jonathan Portes and Howard Reed.
This is based on economic forecasting of trends in relative child poverty after housing costs. What is the actual observed trend? For the past three years for which we have data, child poverty on this measure has remained constant at 30 per cent – Alston claims wrongly that it is “on the rise”. In fact, according to IFS figures, this measurement has never gone above 35 per cent, going back to the 1960s, throughout all economic upheavals.
Looking at the graph below, it is apparent the required 11 percentage point increase by 2021/22 is not going to happen, given current and long-term trends.
Figure 3. Relative child poverty after housing costs with necessary rise in order to meet EHRC projection
While the absolute measure is probably a more meaningful one in terms of measuring material progress, that is not to say either are correctly measuring poverty. My own analysis of Understanding Society data shows while 13 per cent are in relative poverty (before housing costs), the majority of these describe their financial situation as at least “getting by” if not better (see Table 1). Indeed, there were more people classified as in poverty, following standard conventions, describing their financial situation as “living comfortably” than “very difficult”.
Furthermore, 41 per cent of those classed as in poverty had access to satellite television at home, implying disposable income spent on non-essential items. This is inconsistent with most understandings of ‘poverty’.
Across the board, such poverty statistics are not particularly helpful because they capture people who want for very little. This is not to say everything is rosy – we have people in genuine need, with economic precariousness more widely spread. But all this needs to be measured accurately. (According to Eurostat, 4.6 per cent are severely deprived while 34 per cent cannot face unexpected financial expenses.)
And it is an open secret that conventional statistics are not even termed ‘poverty statistics’ in official documentation. They are named for what they are: measures of “relative/absolute low income”.
Table 1. Subjective financial situation by poverty status – Understanding Society Wave IV
Continued in Part 2
SHARE


